


Citilabs unveils Streetlytics to create platform of total population movement
Location Data can tell you where the sampled people are coming from and going to, when they are traveling and where they live and work. But Location Data by itself cannot answer the questions of ‘how many’ and ‘how did they get there’. That’s because Location Data is collected from a segment of the overall population: users of an app, owners of a certain brand of car, or subscribers to a specific cell phone carrier. And, Location Data does not typically have enough location points to determine an accurate route and mode of travel.
For many industries and applications, answering these questions is very important. Tell me, “how many people see my message on an average day?”, “how many people travel from one area to another area?”, “how many vehicles will be on this segment of road at 5pm?” – all important questions to answer. Without a rich understanding of the movement of people, these questions cannot be accurately answered.
Using Optimization to Provide Total Population Movement
In a simple weighting process, one takes Location Data collected from users of a mobile app, determines where those users live, and then estimates a weight based on the number of users of the app compared to the population of the area. This equates to proportionally scaling the sample to the full population based solely on the penetration rate of the app’s use in the area.
While that may sound adequate, it alone is not very accurate. Frequently, when comparing the scaled results against independent data sources such as traffic counts and data quantifying the number of people that live and work in a location, the results obtained through simple weighting are clearly not accurate.
Citilabs’ Streetlytics uses a proprietary optimization process to accurately weight and adjust Location Data. The Streetlytics optimization process works in the following way:

First, create the location data view by scaling the source location data using traditional survey weighting processes. This provides the scaled estimate of total population movement based on the source Location Data.
Second, build a logical view of the probable movement of total population using modelling techniques that Citilabs have developed over the last 40 years. Appling predictive modelling algorithms, developed through the analysis of robust national and regional government travel surveys, to provide accurate, up-to-date household and employment data. These algorithms calculate “how many” trips are likely to travel from each neighbourhood to each neighbourhood, what time of day those trips are likely to occur and what mode of travel is likely being used based on travel behaviour captured in the travel surveys. For instance, if 500 households of a specific type live in this neighbourhood, own these many cars, have access to a certain level of transit service, encounter a certain level of traffic congestion and have a certain number of shops nearby—we can then determine ‘how many’ and ‘where’ those trips ‘should’ be occurring. This ‘logical view’ provides a rationality check in our weighting process and is completely independent of any source Location Data.

Third, collect all of the traffic counts available in each area. Traffic counts have been routinely gathered by governments for years. While these counts may not be perfect, as they are also samples, also weighted and are collected using a variety of techniques, they provide another independent view of “how many” vehicles and people are traveling on a region’s roadways. Knowing how many vehicles each roadway has historically served, including details about how the volumes vary by time of day, day of week, and during the course of a year, ensures that Streetlytics explicitly reflects local traffic dynamics.
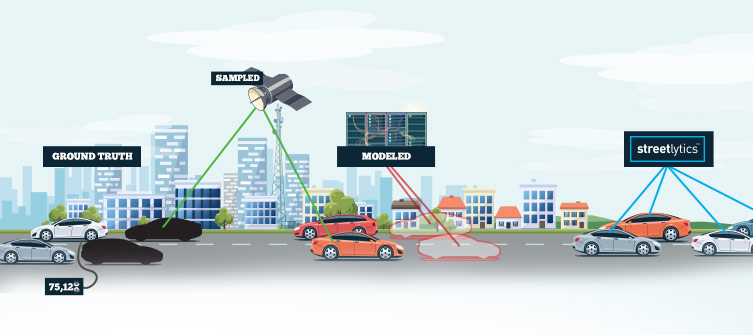
Lastly, apply an optimization process that integrates each of these different ‘views’ of population movement. The weighted and corrected Location Data provides one view, the logical view provides a second and the traffic counts provide a third. The optimization applies varying weights to each of these observations based on their characteristics and quality of the underlying data to combine the independent views into an optimized understanding of total population movement in a region. This process takes the best of each data source maintaining the important spatial and temporal patterns provided by the Location Data, the overall rationality calculated by applying behavioural models on current population and employment data provide by the logical view, while constraining the calculated movements to the measured ground truth.
This process produces a robust and accurate understanding of the entire moving population—telling us where people are coming from and going to, what they pass by, when they travel, where they live and work, and what mode they are likely using.