


INRIX Global Traffic Scorecard finds congestion cost Britain £6.9 billion in 2019
INRIX, a global leader in transportation analytics and connected car services, has published the 2019 INRIX Global Traffic Scorecard, which identified, analyzed and ranked congestion and mobility trends in more than 900 cities, across 43 countries. To reflect an increasingly diverse mobility landscape, the 2019 Global Traffic Scorecard includes both public transport and biking metrics for the first time.
In the UK, the 2019 Global Traffic Scorecard analyzed the severity of congestion across the country’s top 102 urban areas. The findings show, on average, Brits wasted 115 hours in congestion this year, costing the country £6.9 billion in 2019, an average of £894 per driver.
London ranked as the most congested city in the country where the average commuter sat idle for 149 hours per year to congestion. Across the capital, the total damage to the economy exceeded £4.9bn. Belfast (112 hours), Bristol (103 hours), Edinburgh (98 hours) and Manchester (92 hours) complete the top five.
Trevor Reed, transportation analyst at INRIX, said: “Congestion costs drivers, businesses and the UK economy billions of pounds each year. With the rising price of motoring, consumers are getting hit hardest. With the UK budget due soon, hopefully the Chancellor will take the opportunity to address this issue with continued investments in transport networks.
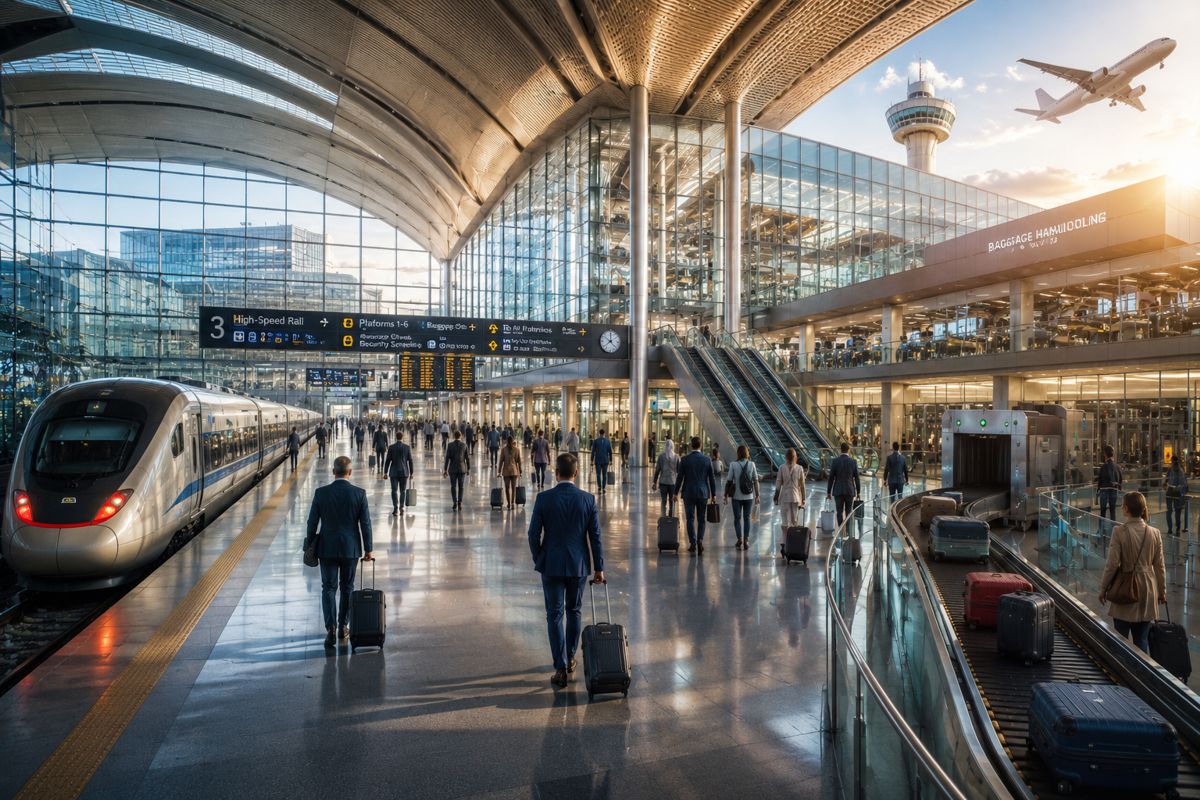
One new initiative is already in place, with Boris Johnson recently approving the controversial High Speed 2 rail network. The first phase of the route will run between London and Birmingham, with a second phase going to Manchester and Leeds. Commenting on the impact it will have on congestion, Trevor Reed, continues:
“HS2 has the potential to decrease car use in the long run by creating a seamless network of rail connections between the UK’s employment hubs.”
Table 1: 10 Most Congested Urban Areas in the UK
| 2019 Congestion Rank (2018) | Urban Area | Hours Lost in Congestion | Cost per City | Inner City Last-Miles Speed |
| 1 (1) | London | 149 | £4.9B | 10 |
| 2 (2) | Belfast | 112 | £117m | 11 |
| 3 (3) | Bristol | 103 | £207M | 13 |
| 4 (4) | Edinburgh | 98 | £117M | 10 |
| 5 (4) | Manchester | 92 | £176M | 14 |
| 6 (8) | Cardiff | 87 | £109 | 16 |
| 7 (7) | Birmingham | 80 | £325M | 11 |
| 8 (8) | Southampton | 79 | £74M | 13 |
| 9 (6) | Nottingham | 78 | £84M | 12 |
| 10 (10) | Hull | 75 | £90M | 15 |
The Most Congested Corridors in the UK
London accounts for the top five worst corridors in the UK, where drivers on the A404/A501 wasted 44 hours in 2019 at peak hours in congestion. Outside the capital, commuters in Birmingham and Bournemouth on the A38 and A338 experienced yearly delays of 32 hours.
Table 2: 5 Most Congested UK Roads in 2019
| Rank | City | Road Name | From | To | Daily delay (minutes) | Yearly delay (hours) |
| 1 | London | A404/A501 | Edgware Road | Old Street | 11 | 44 |
| 2 | London | A4 | Chiswick High Road | Piccadilly Circus | 10 | 40 |
| 3 | London | M25 | A307 | M40 | 9 | 36 |
| 4 | London | A2 | New Cross Gate | Vauxhall | 7 | 28 |
| 5 | London | A202 | A2 | A203 | 6 | 24 |
Table 3: 10 Most Congested UK Roads Outside London in 2019
| Rank | City | Road Name | From | To | Daily delay (minutes) | Yearly delay (hours) |
| 1 | Birmingham | A38 | Northfield | Lancaster Circus | 8 | 32 |
| 2 | Bournemouth | A338 | Hurn Road | St. Paul’s Road | 8 | 32 |
| 3 | Edinburgh | A90/A902 | M90 | A901 | 7 | 28 |
| 4 | Leeds | M62 | A1(M) | M621 | 6 | 24 |
| 5 | Birmingham | M5 | M6 | A38 | 6 | 24 |
| 6 | Manchester | A5103 | M60 | Mancunian Way | 6 | 24 |
| 7 | Liverpool | A5047 | M62 | A580 | 6 | 24 |
| 8 | Edinburgh | A702 | A720 | A700 | 5 | 20 |
| 9 | Manchester | A56 | A560 | M60 | 5 | 20 |
| 10 | Manchester | A663 | A627 | A62 | 4 | 16 |
How UK Cities Compare to Top Cities Worldwide
At the global level, Bogota topped the list of the cities most impacted by traffic congestion with drivers losing 191 hours a year to congestion, followed by Rio de Janeiro (190 hours), Mexico City (158 hours) and Istanbul (150 hours). Latin American and European cities again dominated the Top 10, highlighting the rapid urbanisation occurring in Latin America and historic European cities that took shape long before the age of automobile.
Table 4: 10 Most Congested Cities in the World in 2019
| 2019 Impact Rank | Urban Area | Region | Cost per Driver | Inner City Last-Mile Speed (MPH) |
| 1 | Bogota, Colombia | South America | 191 | 9 |
| 2 | Rio de Janeiro, Brazil | South America | 190 | 15 |
| 3 | Mexico City, Mexico | North America | 158 | 12 |
| 4 | Istanbul, Turkey | Asia | 150 | 11 |
| 5 | Rome, Italy | Europe | 166 | 11 |
| 6 | São Paulo, Brazil | South America | 150 | 13 |
| 7 | Paris, France | Europe | 165 | 10 |
| 8 | London, UK | Europe | 149 | 10 |
| 10 | Chicago, Illinois | North America | 145 | 11 |
Access to reliable data is the first step in tackling congestion. Applying big data to create intelligent transportation systems is key to solving urban mobility problems. INRIX data and analytics on traffic, parking and population movement help city planners and engineers make data-based decisions to prioritise spending in order to maximise benefits and reduce costs now and for the future.
The key findings of the INRIX 2019 Global Traffic Scorecard provide a quantifiable benchmark for governments and cities across the world to measure progress to improve urban mobility and track the impact of spending on smart city initiatives.