


MIT Geologists use erupted sea glass to take the Earth’s inner temperature
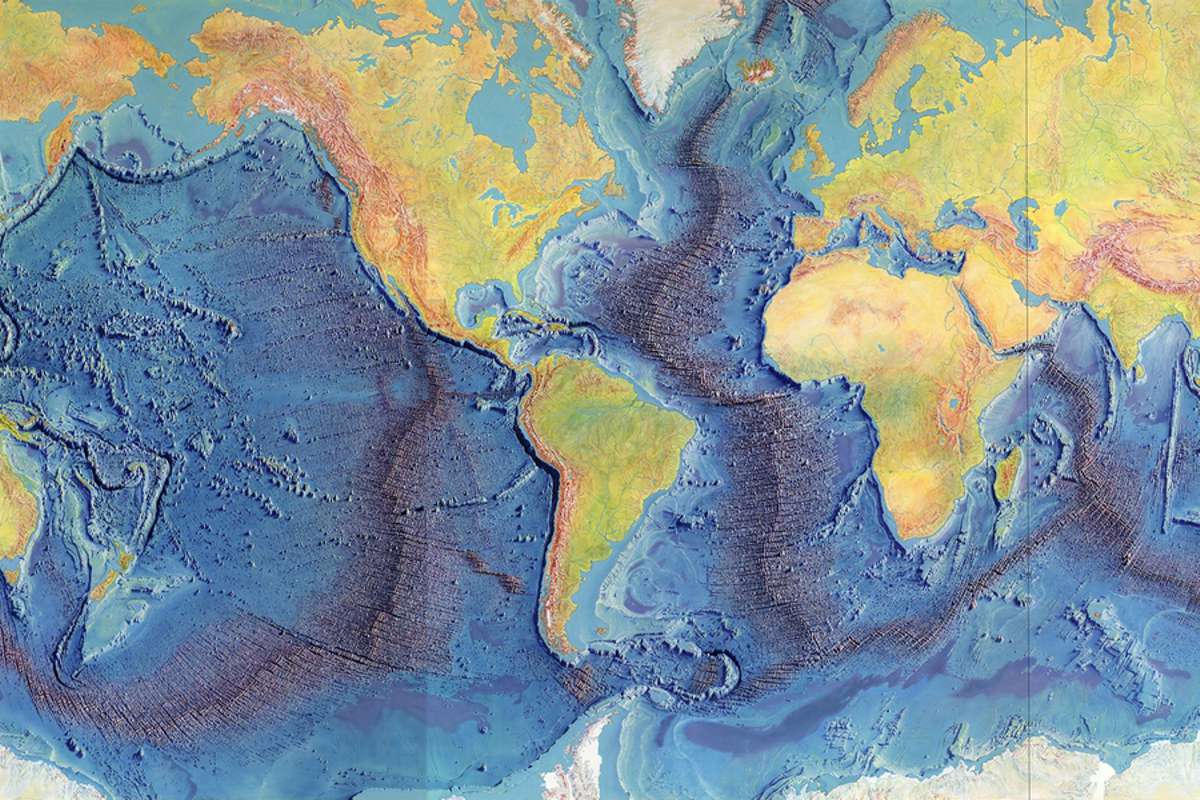
If the Earth’s oceans were drained completely, they would reveal a massive chain of undersea volcanoes snaking around the planet. This sprawling ocean ridge system is a product of overturning material in the Earth’s interior, where boiling temperatures can melt and loft rocks up through the crust, splitting the sea floor and reshaping the planet’s surface over hundreds of millions of years.
Now geologists at MIT have analysed thousands of samples of erupted material along ocean ridges and traced back their chemical history to estimate the temperature of the Earth’s interior.
Their analysis shows that the temperature of the Earth’s underlying ocean ridges is relatively consistent, at around 1,350 degrees Celsius — about as hot as a gas range’s blue flame. There are, however, “hotspots” along the ridge that can reach 1,600 degrees Celsius, comparable to the hottest lava.
The team’s results, appearing in the Journal of Geophysical Research: Solid Earth, provide a temperature map of the Earth’s interior around ocean ridges. With this map, scientists can better understand the melting processes that give rise to undersea volcanoes, and how these processes may drive the pace of plate tectonics over time.
“Convection and plate tectonics have been important processes in shaping Earth history,” says lead author Stephanie Brown Krein, a postdoc in MIT’s Department of Earth, Atmospheric and Planetary Sciences (EAPS). “Knowing the temperature along this whole chain is fundamental to understanding the planet as a heat engine, and how Earth might be different from other planets and able to sustain life.”
Krein’s co-authors include Zachary Molitor, an EAPS graduate student, and Timothy Grove, the R.R. Schrock Professor of Geology at MIT.
A chemical history
The Earth’s interior temperature has played a critical role in shaping the planet’s surface over hundreds of millions of years. But there’s been no way to directly read this temperature tens to hundreds of kilometres below the surface. Scientists have applied indirect means to infer the temperature of the upper mantle — the layer of the Earth just below the crust. But estimates thus far are inconclusive, and scientists disagree about how widely temperatures vary beneath the surface.
For their new study, Krein and her colleagues developed a new algorithm, called ReversePetrogen, that is designed to trace a rock’s chemical history back in time, to identify its original composition of elements and determine the temperature at which the rock initially melted below the surface.
The algorithm is based on years of experiments carried out in Grove’s lab to reproduce and characterize the melting processes of the Earth’s interior. Researchers in the lab have heated up rocks of various compositions, reaching various temperatures and pressures, to observe their chemical evolution. From these experiments, the team has been able to derive equations — and ultimately, the new algorithm — to predict the relationships between a rock’s temperature, pressure, and chemical composition.
Krein and her colleagues applied their new algorithm to rocks collected along the Earth’s ocean ridges — a system of undersea volcanoes spanning more than 70,000 kilometres in length. Ocean ridges are regions where tectonic plates are spread apart by the eruption of material from the Earth’s mantle — a process that is driven by underlying temperatures.
“You could effectively make a model of the temperature of the entire interior of the Earth, based partly on the temperature at these ridges,” Krein says. “The question is, what is the data really telling us about the temperature variation in the mantle along the whole chain?”
Mantle map
The data the team analysed include more than 13,500 samples collected along the length of the ocean ridge system over several decades, by multiple research cruises. Each sample in the dataset is of an erupted sea glass — lava that erupted in the ocean and was instantly chilled by the surrounding water into a pristine, preserved form.
Scientists previously identified the chemical compositions of each glass in the dataset. Krein and her colleagues ran each sample’s chemical compositions through their algorithm to determine the temperature at which each glass originally melted in the mantle.
In this way, the team was able to generate a map of mantle temperatures along the entire length of the ocean ridge system. From this map, they observed that much of the mantle is relatively homogenous, with an average temperature of around 1,350 degrees Celsius. There are however, “hotspots,” or regions along the ridge, where temperatures in the mantle appear significantly hotter, at around 1,600 degrees Celsius.
“People think of hotspots as regions in the mantle where it’s hotter, and where material may be melting more, and potentially rising faster, and we don’t exactly know why, or how much hotter they are, or what the role of composition is at hotspots,” Krein says. “Some of these hotspots are on the ridge, and now we may get a sense of what the hotspot variation is globally using this new technique. That tells us something fundamental about the temperature of the Earth now, and now we can think of how it’s changed over time.”
Krein adds: “Understanding these dynamics will help us better determine how continents grew and evolved on Earth, and when subduction and plate tectonics started — which are critical for complex life.”
This research was supported, in part, by the National Science Foundation.