


TRL identifies Metrics for Autonomous Vehicle Safety Assessment
One of the main motivations for the development and adoption of AVs is improved road safety – primarily through the reduction in severity and frequency of collisions resulting from human error.
But how should we actually be assessing safety performance of AVs? Direct comparison to human-driven vehicles on the basis of collisions would require several millions or even billions of miles to be driven by a system before statistically significant conclusions could be drawn; this data simply won’t be available in the early stages of AV deployment, and neither will necessarily include the statistically outliers or ‘edge cases’.
Even then, AVs are likely to continuously evolve during life via regular updates, unlike conventional vehicles which are manufactured and maintained to a fixed standard. A typical type approval system that is currently used for conventional vehicles would only approve an AV at a snapshot of when it first went into service. So, what are the metrics by which we should be assessing the safety of AVs, and how can we monitor and evaluate them on a continuous basis?
The need for safety performance metrics continues to be a recurring recommendation from regulatory and research bodies, but to date, few answers have emerged.
Safety metrics fall into two main categories; lagging and leading. Lagging metrics are also known as safety outcomes and include well-defined events such as collisions. Leading metrics are precursors to those outcomes, such as unsafe behaviour or near misses. These occur far more often than safety outcomes, providing more learning opportunities. Crucially, they also enable risks to be identified and mitigated before any harm arises. Unfortunately, these measures tend to be more nebulous, difficult to define, and often difficult to measure. Indeed, a widely accepted definition of what constitutes a near miss, along with objective methods for classifying and measuring them, does not exist.
Part of the problem is that it is very challenging to pinpoint exactly what it is about unsafe behaviour that makes it unsafe. Intuitively, we know that actions such as driving with excessive speed or acceleration or driving very close to others increases the risk of collision for human drivers. However, there hasn’t been sufficient data gathered from AVs to tease out the exact links between these kinds of leading metrics and the lagging safety outcomes that we are trying to avoid. Herein lies another challenge, some leading metrics may well apply differently to Automated Driving Systems (ADSs) compared to human drivers.
Identifying Leading Metrics for AVs
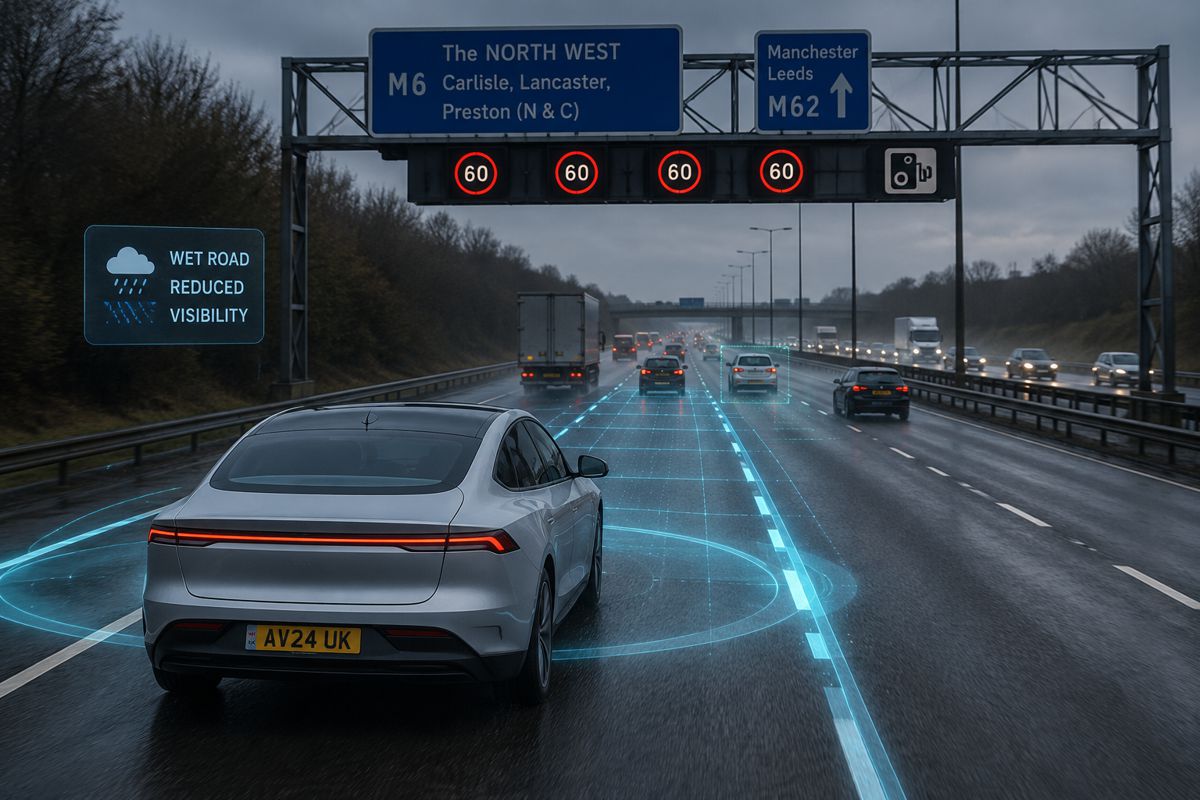
During operation, AVs collect vast quantities of data from a plethora of sensors in order to operate successfully, such as vehicle positional and kinematic data, and detailed information about the surrounding environment and other actors. Some of this data could hold the key to uncovering the relationships between the way the ADS conducts the driving task, and how likely it is to be involved in a collision.
The most widespread leading metric currently in use is data from disengagements, where control of the vehicle transitions from the ADS to the safety driver, either at the request of the ADS or as a result of intervention from the safety driver. In the absence of any other performance metrics, this has been over-relied on as a proxy for safety. This metric is easily understood by the public, and systems with low disengagements per mile have been seen as inherently safer than those with more disengagements. However, this dataset fails to capture sufficient detail regarding the scenario in which the disengagement occurred and the reason behind it. For example, an ADS being tested in a dense urban environment may disengage more frequently than the same system tested on a quiet motorway. Taken in isolation, disengagement data does not give an accurate representation of the safety of a system nor does it enable a fair comparison between systems.
In recent years, criticism of disengagement data as a performance metric has become more widespread, with several institutions and research bodies highlighting the need for a more thorough framework. Only very recently is this gap beginning to be filled, notably by the publications Measuring automated vehicle safety by the RAND Corporation and Best practice for metrics and methods for assessing safety performance of Automated Driving Systems by SAE’s Automated Vehicle Safety Consortium. These papers have made progress in suggesting alternative safety metrics and proposing frameworks for implementing them within current operating practices. TRL is in agreement with the findings within these papers and welcomes the developments toward safer AVs.
TRL has also conducted research into this topic under Project Endeavour to further the development of safety assurance processes for AVs. This included a review of literature and informal engagement with a small number of industry stakeholders.
As part of this study, TRL assessed the suitability of a range of metrics. Each metric was reviewed against how well we believed it would meet the following objectives:
- Has a recognised link with an adverse safety event
- Does not encourage unfavourable driving or behaviours, and cannot be manipulated
- Is reliable, repeatable, and measurable
We do not believe that this problem can be solved through the application of a single metric. Rather, we envisage that a set of metrics will be required, with each forming part of the solution. The leading metrics we have assessed to date generally fall into six broad categories. Within each category, the specific metrics could be used in isolation or as part of a wider dataset.
- A measure of driving-related infractions. This may include running a red light or speeding. Infractions have a statistically significant relationship with collisions in human drivers and we believe that a similar relationship will exist with AVs and infractions, especially those concerning right of way.
- Potential or real safety envelope violations. The safety envelope is the boundary around the vehicle, generally measured in distance or time, inside which an object becomes a safety concern to the vehicle. Examples of metrics in this category include vehicle headway and time-to-collision.
- A measure of driving style. This may include vehicle kinematics, such as speed and acceleration, and triggers of vehicle safety systems.
- Measure of incomplete missions. This may include incomplete trips, number of minimal risk manoeuvre (MRM) triggers, system failures, Operation Design Domain (ODD) violations, and disengagements. While taking disengagements in isolation has limited value, the listed events all indicate reasons the vehicle was not able to complete its mission and will potentially have resulted in an unsafe event, therefore warrant further investigation.
- Hazard identification and reaction, and risk perception. This may include the time at which a risk was identified, or how successful the ADS is at recognising particular hazards.
- Qualitative user feedback, including from passengers and other road users. For the foreseeable future, an AV operating in public spaces will interact with people in some way, so being able to do so in a controlled and predictable manner is necessary.
“Looking ahead, there are still many questions to be answered regarding which metrics should be used to assess AV safety on a continuous basis. It is a multifaceted challenge with several unknown parameters and one that will likely take several iterations of real-world testing before anything resembling a consensus is reached.”
We expect these to evolve over time as more is understood about the relationships between these leading metrics and lagging safety outcomes. For example, many of the metrics above need to be explicitly defined and will be recorded in the format of a count of instances when the value passed a pre-specified threshold. More work is required to specify these thresholds and we believe that real-world experience will be required to define these relationships, as well as how the appropriate threshold may change for different scenarios.
Additionally, there will be events within a category that are part of normal operation and are not safety-related, so we expect that, at least initially, this data will require some degree of post-processing to filter out those events.
Looking ahead, there are still many questions to be answered regarding which metrics should be used to assess AV safety on a continuous basis. Simply put, it’s really difficult! It is a multifaceted challenge with several unknown parameters and one that will likely take several iterations of real-world testing before anything resembling a consensus is reached.
Comparing this data against human-driven vehicles is likely to remain difficult, since this level of information is not recorded for human drivers. We expect that direct comparison between AVs and humans will continue to be done based on lagging measures. If human drivers are not the benchmark, then the all-important question for defining metrics, thresholds, and ultimately the whole framework, will be “how safe is safe enough?”
Indeed, we know this is not the final answer. As an industry, we’re currently in a bit of a catch-22 situation. We need to collect data from AVs to be able to draw conclusions about what data we need to collect from AVs! That is why we believe the most important thing is for developers, manufacturers, and other relevant stakeholders to start recording something, as this data will provide a valuable piece of the puzzle.
Article by Ben Simpson, Safety Researcher at Trl