


Esri updates Land-Cover Maps with new global datasets
Governments and businesses across the world are pledging to adopt more sustainable and equitable practices. Many are also working to limit activities that contribute to climate change. To support these efforts, Esri, the global leader in location intelligence, in partnership with Impact Observatory and Microsoft, is releasing a globally consistent 2017–2021 global land-use and land-cover map of the world based on the most up-to-date 10-meter Sentinel-2 satellite data.
In addition to the new 2021 data, 10-meter land-use and land-cover data for 2017, 2018, 2019, and 2020 is included, illustrating five years of change across the planet.
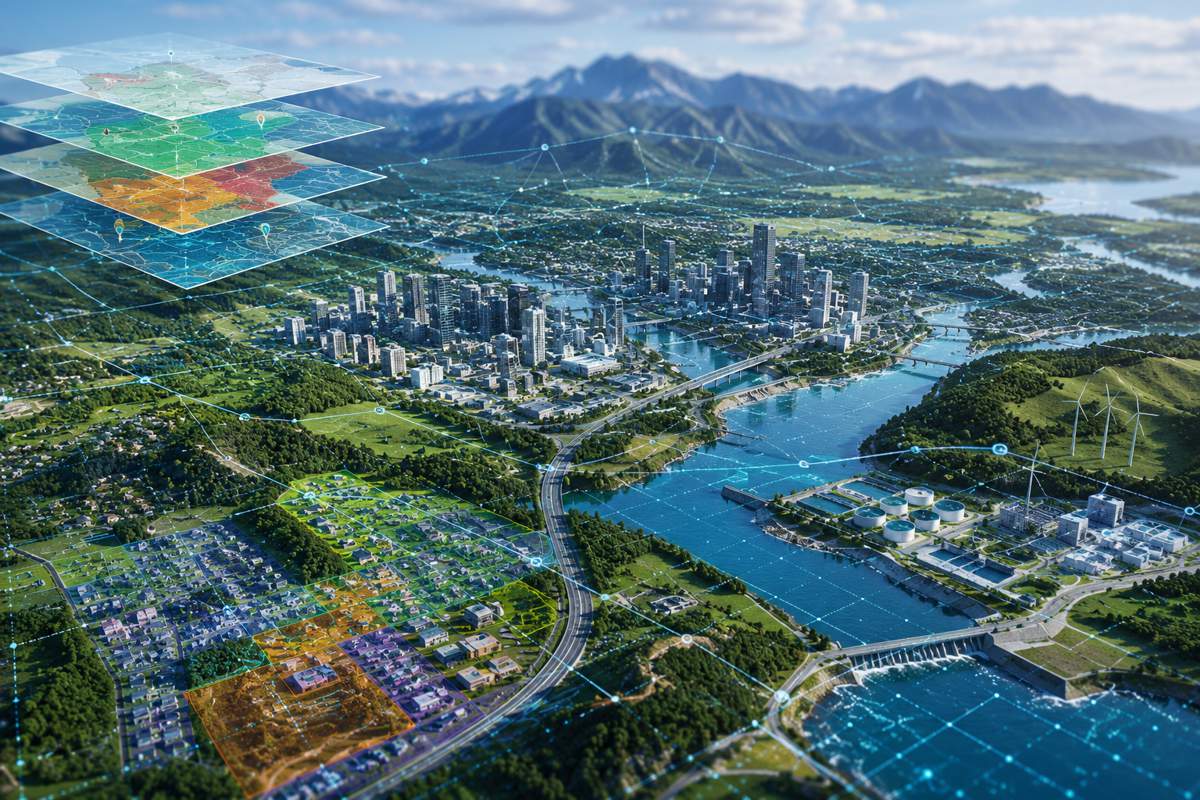
This digital rendering of earth’s surfaces offers detailed information and insights about how land is being used. The map is available online to more than 10 million users of geographic information system (GIS) software through Esri’s ArcGIS Living Atlas of the World, the foremost collection of geographic information and services, including maps and apps.
“Accurate, timely, and accessible maps are critical for understanding the rapidly changing world, especially as the effects of climate change accelerate globally,” said Jack Dangermond, Esri founder and president. “Planners worldwide can use this map to better understand complex challenges and take a geographic approach to decisions about food security, sustainable land use, surface water, and resource management.”
Esri released a 2020 global land-cover map last year as well as a high-resolution 2050 global land-cover map, showing how earth’s land surfaces might look 30 years from now. With the planned annual releases, users will have the option to make year-to-year comparisons for detecting change in vegetation and crops, forest extents, bare surfaces, and urban areas.
These maps also provide insights about locations with distinctive land use/land cover, as well as human activity affecting them. National government resource agencies use land-use/land-cover data as a basis for understanding trends in natural capital, which helps define land-planning priorities and determine budget allocations.
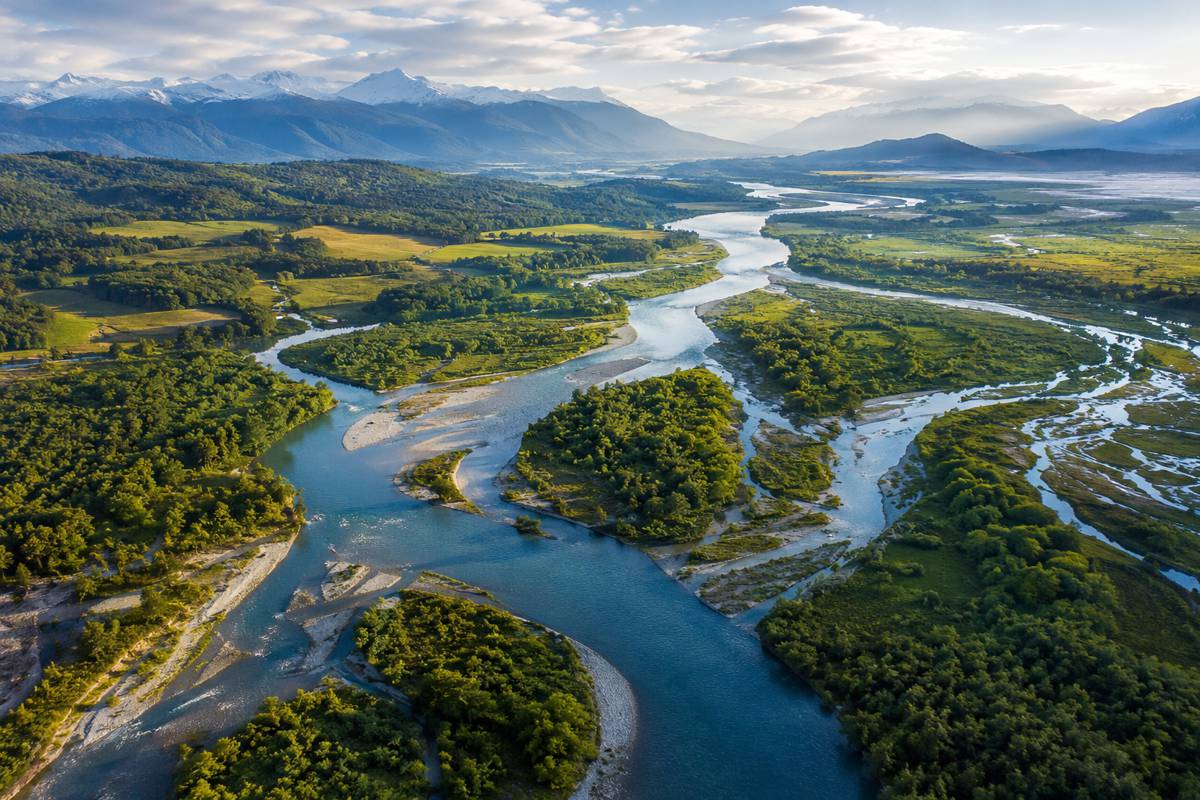
Esri’s map layers were developed with imagery from the European Space Agency (ESA) Sentinel-2 satellite, with machine learning workflows by Esri Silver partner Impact Observatory and incredible compute resources from long-time partner Microsoft. The Sentinel-2 satellite carries a range of technologies including radar and multispectral imaging instruments for land, ocean, and atmospheres, enabling it to monitor vegetation, soil and water cover, inland waterways, and coastal areas.
“World leaders need to set and achieve ambitious targets for sustainable development and environmental restoration,” said Steve Brumby, Impact Observatory cofounder and CEO. “Impact Observatory [and] our partners Esri and Microsoft are once again first to deliver an annual set of global maps at unprecedented scale and speed. These maps of changing land use and land cover provide leaders in governments, industry, and finance with a new AI [artificial intelligence]-powered capability for timely, actionable geospatial insights on demand.”
Esri and Microsoft have released this 10-meter-resolution time-series map under a Creative Commons license to encourage broad adoption and ensure equitable access for planners working to create a more sustainable planet. Users can manipulate the map layers and other data layers with GIS software to create more dynamic visualizations.
In addition to being freely available in ArcGIS Online as a map service, these resources are also available for download and viewing.