


A New Global View Of The Built Environment
A breakthrough in global geospatial research has emerged from the Technical University of Munich, where a team led by Prof. Xiaoxiang Zhu has created the GlobalBuildingAtlas, the first high-resolution three-dimensional map of every building on Earth. The dataset represents a remarkable leap in global observation capacity, particularly for climate science, sustainable development and infrastructure planning.
The atlas contains 2.75 billion building models derived from satellite imagery recorded in 2019, offering a level of precision unmatched by earlier attempts. Previous datasets topped out at around 1.7 billion structures, often constrained by limited regional coverage or coarse spatial resolution. The GlobalBuildingAtlas, by comparison, delivers 3×3 metre detail and includes underserved regions such as sub-Saharan Africa, parts of South America and vast rural territories worldwide. This sharper, more complete view draws on research supported by an ERC Starting Grant and sets a new global standard for building-level intelligence.
The scale alone signals a major shift in how researchers, governments and urban planners may approach global development challenges. Its importance, however, stretches far beyond its size. The dataset captures the shape, height and spatial distribution of nearly every building on the planet, enabling new forms of analysis that were impossible with traditional two-dimensional mapping.
Elevating Climate And Sustainability Research
Climate science depends heavily on high-quality, high-resolution spatial data. Buildings are central to that data story. They concentrate population, consume energy, generate emissions and determine local microclimates. Until recently, though, global models had to rely on building footprints extracted from 2D maps, leaving out the critical dimension of height.
Prof. Zhu highlights the significance of this new depth of insight: “3D building information provides a much more accurate picture of urbanization and poverty than traditional 2D maps. With 3D models, we see not only the footprint but also the volume of each building, enabling far more precise insights into living conditions. We introduce a new global indicator: building volume per capita, the total building mass relative to population – a measure of housing and infrastructure that reveals social and economic disparities. This indicator supports sustainable urban development and helps cities become more inclusive and resilient.”
This volume-based metric aligns closely with several UN Sustainable Development Goals, including sustainable cities, poverty reduction and climate action. By examining building mass rather than simply building count, policymakers can identify overcrowded areas, underdeveloped neighbourhoods or urban zones with inadequate infrastructure. It also provides a clearer picture of social inequality, offering a quantifiable spatial indicator that can be tracked over time.
The dataset also supports energy modelling by enabling more accurate estimations of heating and cooling loads, rooftop solar potential and urban heat island effects. Its global scale allows for comparisons across nations and climates, giving researchers the ability to evaluate which urban forms mitigate or exacerbate energy demand.
Expanding Global Coverage To Underrepresented Regions
One of the most transformative aspects of the GlobalBuildingAtlas is its inclusion of locations often overlooked in global datasets. Earlier maps lacked sufficient coverage in large portions of Africa, South America and rural Asia, creating an imbalance in global modelling. This gap has long hindered development policy, disaster preparation and regional climate adaptation strategies.
By capturing buildings across these regions in high fidelity, the atlas corrects a major blind spot in international planning frameworks. Policymakers can now assess settlement patterns, building density and urban growth in communities that previously existed as statistical estimates. This makes a considerable difference when allocating funding, planning infrastructure or responding to emerging climate risks.
Moreover, the inclusion of Level of Detail 1 models for 97 percent of all captured buildings marks a significant improvement over earlier mapping efforts. These LoD1 models provide simplified, yet structurally meaningful, representations of building heights and shapes, which are computationally efficient and suitable for continental-scale modelling.
A Foundation For Smarter Cities
The GlobalBuildingAtlas is not simply a scientific achievement. It is also a practical tool for shaping future cities. Its open-access model allows urban planners, engineers and government agencies to integrate the data directly into digital twins, planning software and geospatial workflows.
The applications extend across multiple domains:
- Housing and infrastructure planning: Authorities can identify where to expand residential capacity or public facilities such as schools, community centres or healthcare buildings.
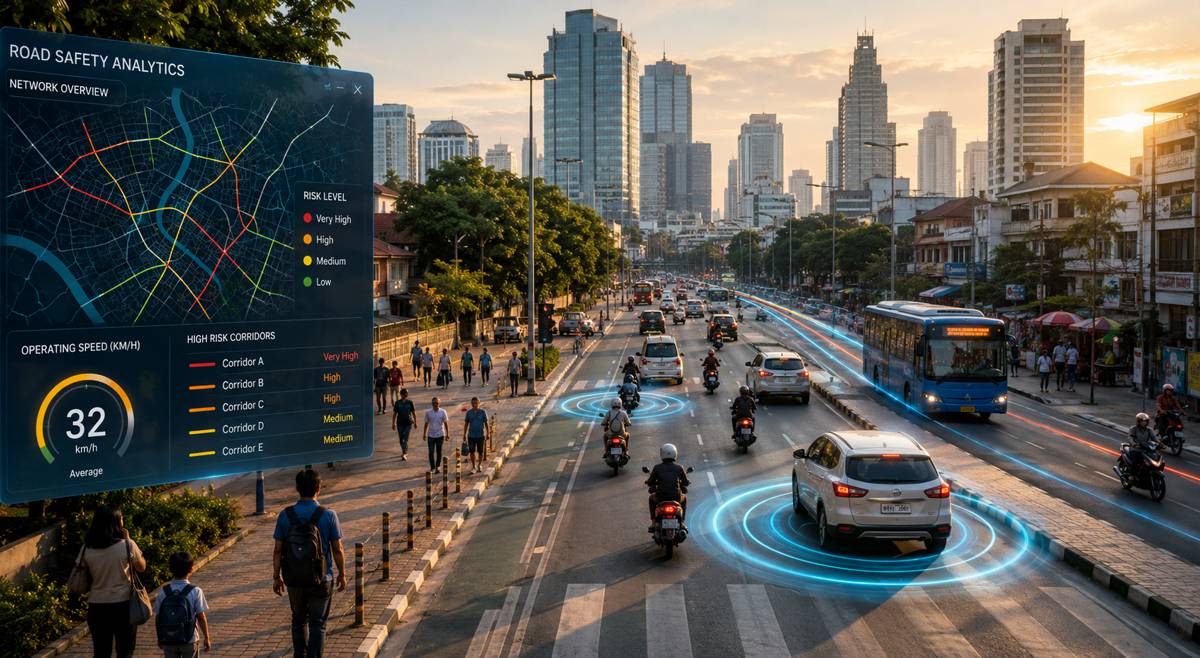
- Transport network design: Road and transit planners can analyse settlement patterns to identify underserved corridors.
- Utility grid management: Electricity and water providers can evaluate demand distribution and prepare for future population changes.
- Environmental modelling: Simulations of flood risk, seismic vulnerability or pollution dispersion can incorporate detailed 3D structural data.
In rapidly growing cities, particularly in Asia and Africa, this level of detail supports evidence-based planning that could reduce congestion, strengthen safety and improve long-term resilience.
Strengthening Disaster Prevention And Response
A major driver behind global building mapping has always been disaster management. Accurate, up-to-date spatial models can save lives by improving hazard prediction and emergency response.
The German Aerospace Center (DLR) is already evaluating the atlas for use within the International Charter: Space and Major Disasters. This programme coordinates satellite support for disaster-hit regions, ensuring rapid access to earth observation data after floods, earthquakes, hurricanes or landslides.
High-resolution buildings help responders determine:
- which neighbourhoods face the highest structural risk,
- where rescue infrastructure should be deployed,
- how to model expected damage scenarios, and
- how to identify safe evacuation routes.
The precision of the LoD1 dataset also allows insurers, humanitarian agencies and national governments to perform vulnerability assessments long before disasters occur, a key component of resilience planning.
Studies from the World Bank and the UN Office for Disaster Risk Reduction have repeatedly emphasised the role of detailed building data in climate-risk modelling. Until now, however, these models relied on patchy or incomplete datasets. The GlobalBuildingAtlas changes that, offering a worldwide baseline that can be integrated into regional hazard frameworks.
A New Tool For Global Urban Research
Academics working in urban analytics, remote sensing and geoinformatics gain a robust foundation for exploring how cities evolve. Global comparisons become easier and more accurate. For example, researchers can analyse how vertical expansion differs between rapidly developing cities like Lagos or Dhaka compared with slower-growing counterparts in Europe.
The dataset also supports new work in:
- Sustainable urban morphology: evaluating which built forms promote efficient energy usage.
- Population modelling: refining demographic estimates at the neighbourhood scale.
- Land-use policy: assessing how informal settlements grow and change with time.
- Health and environmental exposure analysis: linking building volume to air quality, noise or access to ventilation.
This flexibility makes the atlas an important component for interdisciplinary studies seeking to connect human behaviour, environmental conditions and the built environment.
Looking Ahead
The GlobalBuildingAtlas represents a major step toward a more detailed and equitable understanding of the world’s urban fabric. Its open availability ensures broad adoption across scientific, policy and industrial communities. As cities grapple with population growth, climate pressure and new development demands, having a global 3D foundation will help deliver more resilient and inclusive strategies.
Although the atlas marks an extraordinary milestone, it also lays the groundwork for further advancements. Future iterations may provide time-series data, higher LoD detail or live integration with advanced radar and optical satellite constellations. For now, though, this release provides an unprecedented snapshot of the built world and offers a cornerstone for research and innovation.