


ASCE and Esri Join Forces to Revolutionise Infrastructure Planning
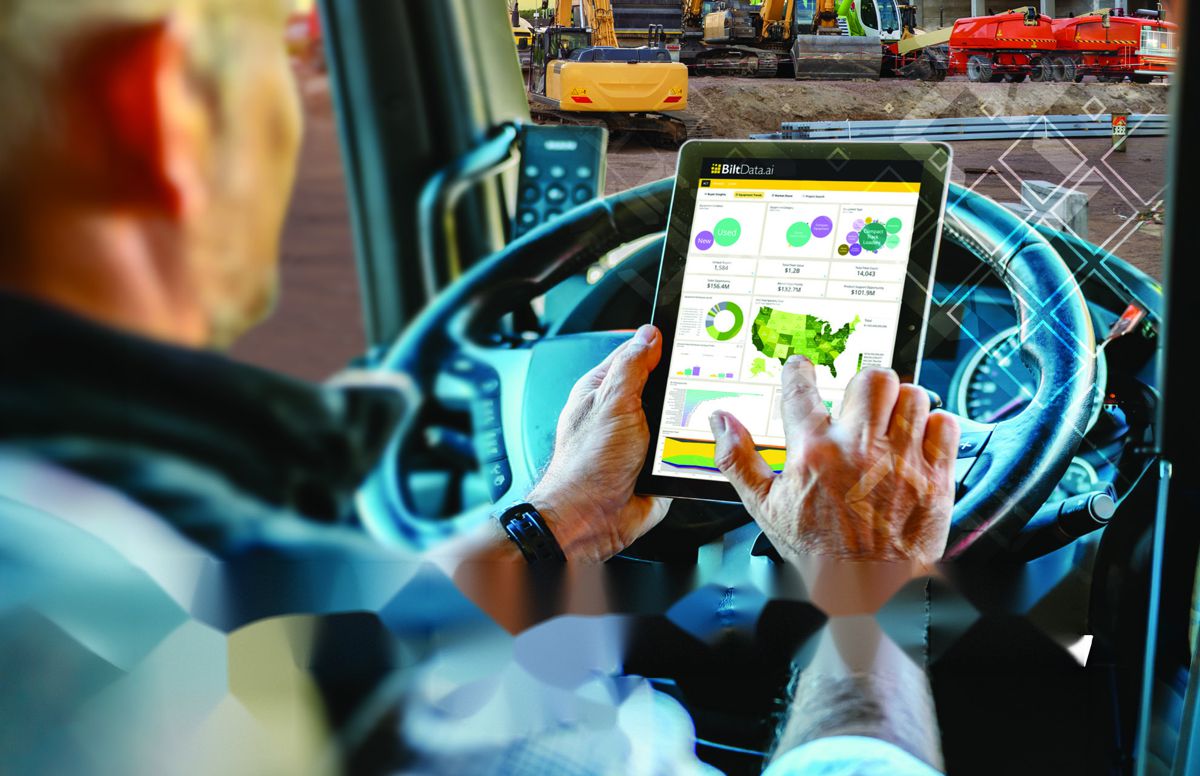
In a game-changing move for infrastructure planning and public policy, the American Society of Civil Engineers (ASCE) has unveiled its 2025 Report Card for America’s Infrastructure. But this year, there’s a twist: ASCE has joined forces with Esri, the global powerhouse in geographic information systems (GIS), to bring the data to life through interactive ArcGIS StoryMaps. The result? A compelling digital narrative that doesn’t just inform—it inspires action.
Gone are the days of poring over dense, static documents. With StoryMaps, users can dive into rich multimedia layers, engaging visuals, and dynamic geographic data that paint a vivid picture of how America’s infrastructure is performing. It’s not just about the grades anymore; it’s about telling the full story, one map at a time.
“By showing people how all these infrastructure systems are playing a role in their daily life, ArcGIS StoryMaps helps us make the case about why we need to invest in our infrastructure” said Caroline Sevier, Managing Director of Government Relations and Infrastructure Initiatives at ASCE.
Understanding the Report Card: More than just letters
Since 1998, ASCE has been publishing the Infrastructure Report Card every four years, assigning grades from A to F to various infrastructure sectors across the United States. These include transportation, energy, water systems, schools, and more. The idea is simple yet powerful: deliver an accessible snapshot of how well the nation’s critical systems are functioning.
But the implications run deeper. The grades offer not just a health check but a call to arms. Policymakers, industry leaders, and the public all rely on the report to understand where investment is most needed. With the inclusion of ArcGIS StoryMaps, these insights become easier to digest and, crucially, to act on.
Now, with the click of a button, stakeholders can:
- Zoom in on regional data
- Understand the interconnectedness of infrastructure systems
- Explore historical trends and projections
- Access multimedia content for greater context
And let’s face it—in today’s information-saturated world, that kind of clarity is gold dust.
Why GIS is a game-changer for public planning
Enter Esri. Founded in 1969 in Redlands, California, Esri has become the global leader in GIS technology. With software used by Fortune 500 companies, government departments, NGOs, and academic institutions in over 100 countries, Esri’s reach is nothing short of extraordinary.
Linda Foster, Director of Land Records and Cadastre at Esri, summed it up neatly: “By leveraging data and maps, GIS provides key insights to help decision makers maximise investments and bolster resiliency to help keep America’s communities safe and sustainable into the future.”
In short, Esri’s geospatial technology doesn’t just show you where things are—it reveals how they’re working (or not), why they matter, and what we can do about it.
Enhancing transparency, improving outcomes
Transparency is a word often thrown around in public discourse, but here, it finds real meaning. With StoryMaps, federal, state, and local governments gain a tool that enables real-time visualisation and storytelling around the health of infrastructure assets.
Officials no longer have to guess which bridges, roads, or water systems are deteriorating. They can visualise it. More importantly, they can show constituents and investors exactly what the issues are and how proposed improvements will help.
This level of engagement makes it easier to:
- Justify funding requests
- Prioritise high-impact projects
- Track infrastructure performance over time
- Collaborate across jurisdictions
As infrastructure systems grow more complex and interdependent, this bird’s-eye view becomes not just useful, but essential.
A living document for a moving target
One of the most transformative aspects of the 2025 Report Card’s digital evolution is its ability to adapt. While the traditional report card only sees the light of day every four years, ArcGIS StoryMaps provide a platform for incremental updates, ensuring decision-makers always have the most current data at their fingertips.
Infrastructure isn’t static. Roads deteriorate, water mains burst, and power grids are stressed by climate extremes. With the StoryMaps approach, planners and engineers can respond in near real time.
That kind of flexibility also enables:
- Responsive policy changes
- Timely grant applications
- Ongoing public education
In essence, it’s a smarter tool for a smarter age.
Beyond the data: Building a culture of investment
Perhaps the most important takeaway from this collaboration is cultural. By bringing infrastructure issues to life, ASCE and Esri are helping build public understanding and political will.
Let’s be honest: bridges and sewage systems aren’t exactly the stuff of viral TikToks. But when you can show, not just tell, how a neglected water system endangers a neighbourhood or how an upgraded road reduces commute times and emissions, the message sticks.
Caroline Sevier put it best: “Showing an overall system of systems approach to infrastructure and how it’s all interconnected allows us to visualise these issues and look at infrastructure at multiple scales.”
This interconnected perspective is crucial for developing policies that are both cost-effective and future-proof.
What the future holds
Looking ahead, the potential applications of ArcGIS StoryMaps in infrastructure extend far beyond report cards. From climate resilience to smart city planning and disaster response, the combination of narrative and spatial data will continue to shape how governments plan, build, and adapt.
As the lines between digital and physical infrastructure blur, tools like Esri’s StoryMaps will become indispensable. Not only do they enhance data-driven decision-making, but they also help us build a shared vision for the future—one that’s sustainable, equitable, and informed.
Explore the full 2025 Report Card for America’s Infrastructure and the interactive GIS Story Map online.
Paving the Way for Resilient Infrastructure
With the stakes higher than ever and budgets tighter than we’d like, making smarter infrastructure decisions is not just a goal—it’s a necessity. Thanks to the collaboration between ASCE and Esri, those decisions can now be made with greater confidence, clarity, and community support.
From local councils to Capitol Hill, the 2025 Report Card is no longer just a document—it’s a living, breathing tool for change.