


Decoding the Highway Code changes with Data Insights
Back in 2018 it was announced that a review of the Highway Code would take place. Following a three month stakeholder consultation process in 2020, it has been announced that the new rules will come into action from 29 January 2022, subject to parliamentary approval.
The updates are focused on protecting the safety of pedestrians and cyclists – the most vulnerable road users – by introducing a formalised ‘road user hierarchy’ and clarifying previous guidance to increase effectiveness of the Code.
It’s important that the Highway Code remains relevant to the way people choose to travel and how road networks actually work. These latest changes reflect the large increase in active travel uptake witnessed in the past few years. Safety is a key deciding factor for potential active travellers. By focusing on improving safety for cyclists and pedestrians it’s hoped that these updates will initiate further modal shift towards active travel, helping our cities become more sustainable and communities be healthier, happier and safer.
The overarching theme of the update is the introduction of a formalised ‘road user hierarchy’ with the new rules H1, H2 and H3. This concept ensures that road users who can cause the greatest harm have the greatest responsibility to reduce the dangers they may pose to others. The most vulnerable road users, pedestrians, cyclists and horse riders will be at the top of the hierarchy, with the most potentially dangerous transport modes, heavy goods vehicles, at the bottom.
How will these changes affect the road network?
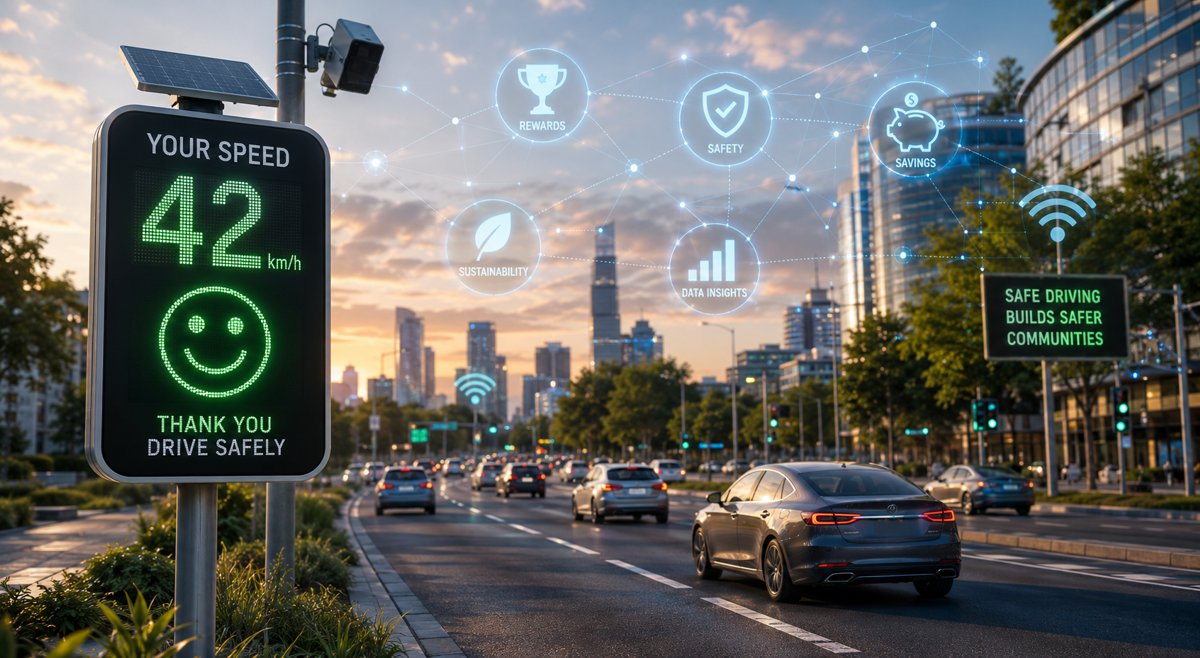
In order to understand if these changes are adopted and how the network is impacted, accurate, 24/7 traffic monitoring is essential. Computer vision sensors have a diverse range of capabilities providing insights on how road space is being used, the behaviour of different transport modes at junctions, interactions and movement patterns, efficiency of the road network in getting people from A to B and average speeds of road users.
These data driven insights are invaluable when it comes to designing new or improving existing schemes for safer, healthier and more sustainable urban environments. Below we’ve listed some examples of how various sensor datasets can help you understand the network better in relation to the proposed Highway Code changes and indicate how they can be optimised.
Desired insight: Has the hierarchy of road users, introduced to protect the most vulnerable and increasing the responsibility of those that can cause most harm, increased the number of pedestrians and cyclists on the roads?
CLASSIFIED COUNTS
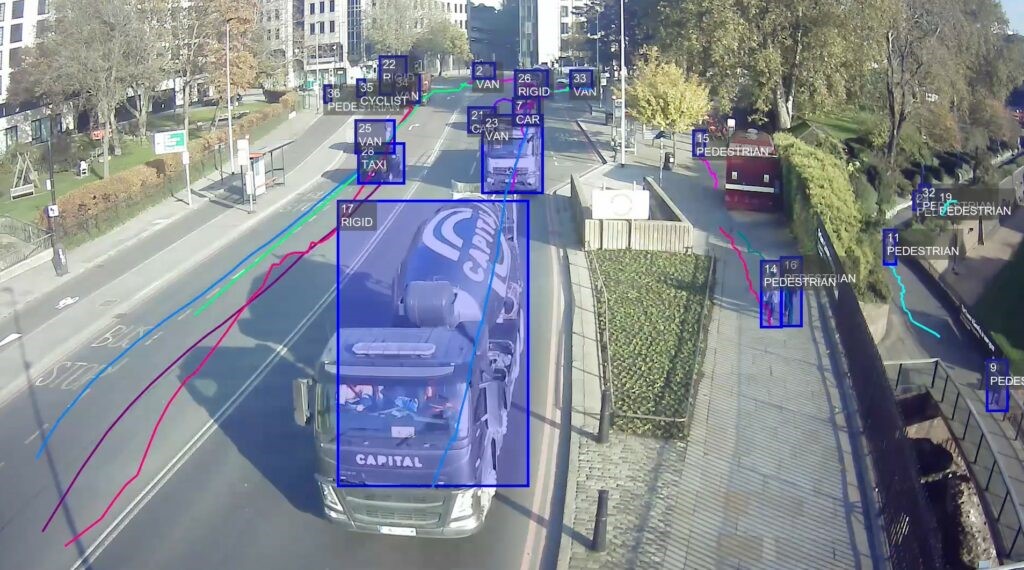
Review the number of pedestrians, cyclists, cars and many other transport modes that are using road space, and identify how these figures fluctuate at different times of the day or week. An increase in active travel modes would suggest that pedestrians and cyclists feel safer on the roads.
Desired insight: Has the new guidance surrounding cyclists and road space changed the areas of the road that cyclists use?
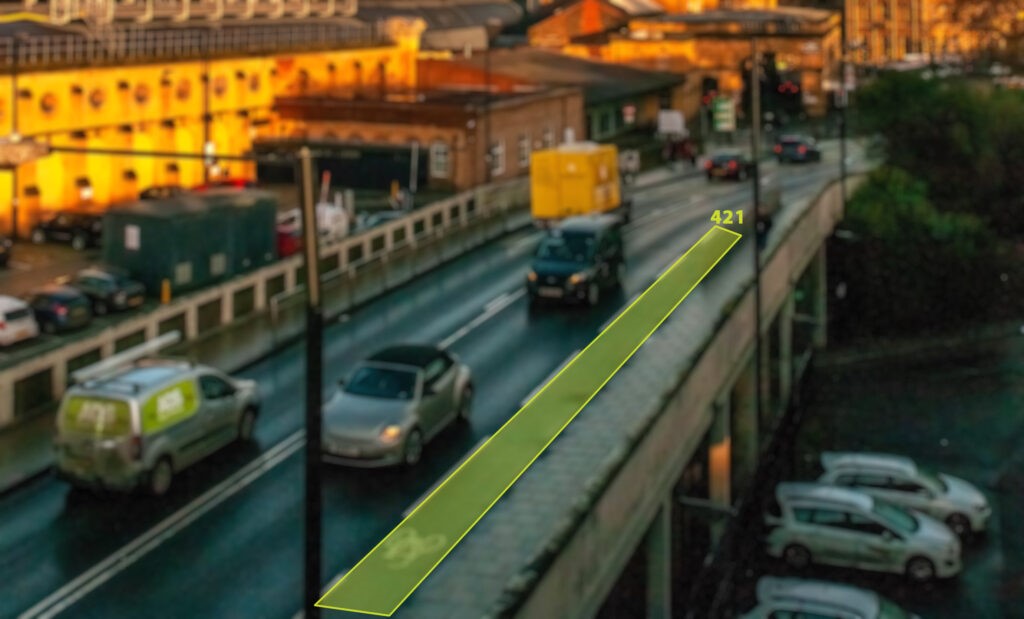
PATHS
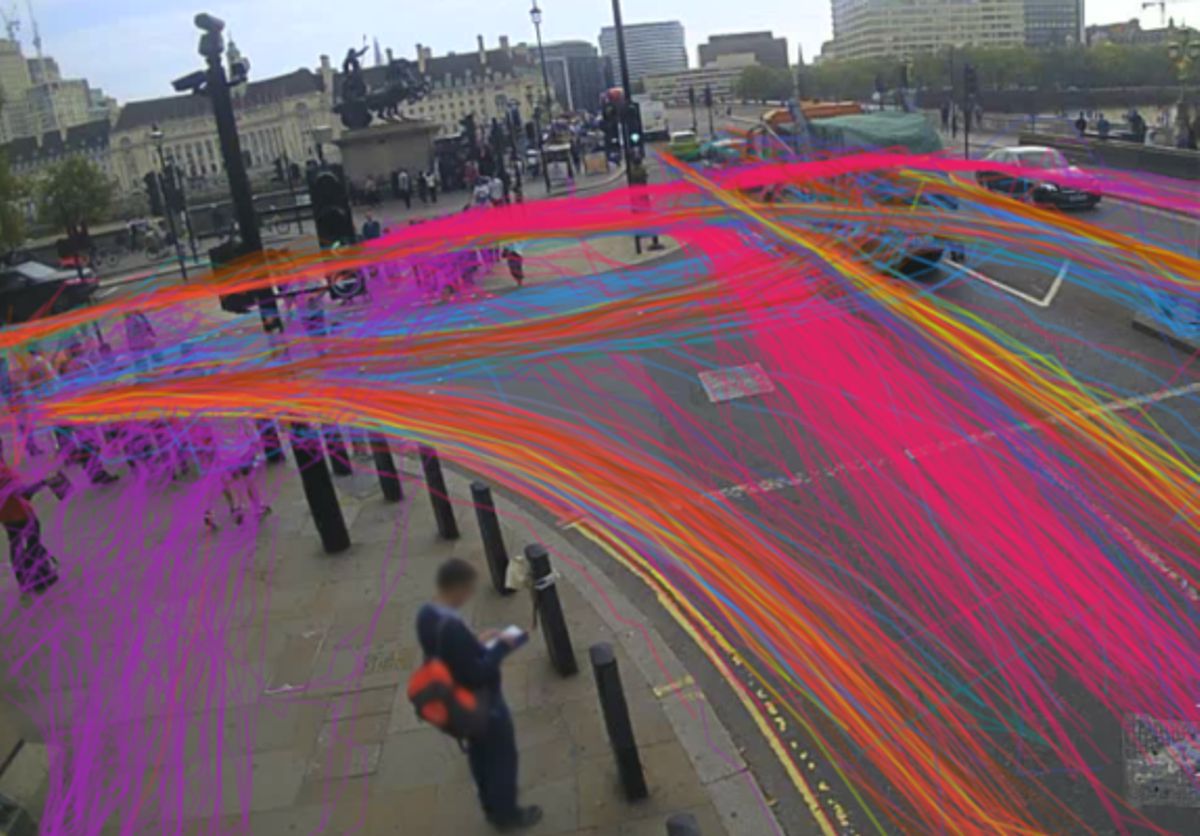
Visualise how cyclists using the road space following the Highway Code’s clarification of road space positioning guidance and identify if usage of allocated cycling infrastructure has been impacted. Paths data can also be gathered for pedestrians and motorised road users, allowing you to see how changes to cyclist behaviour has affected both more and less vulnerable road users.
Desired insight: Have the new rules that state that vulnerable transport modes have priority at junctions (cars giving way to cyclists and pedestrians, and cyclists giving way to pedestrians) affected the efficiency and safety of junctions?
TURNING COUNTS
Analyse the volume, movement and behaviours of different classes of road users around a junction. Identify if this changes throughout the day or week, and assess the safety of road users and where there is room for improvement.
Desired insight: How have updates to the Highway Code affected the efficiency and reliability of the network?
JOURNEY TIMES
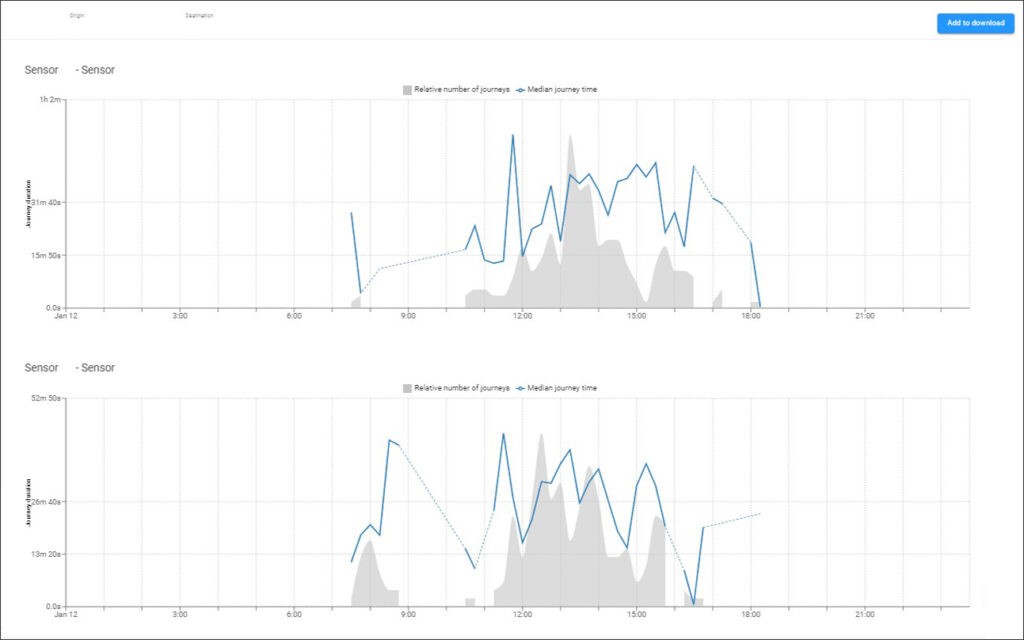
Understand delay and congestion through a network. Sensors use machine learning to accurately detect number plates and provide average journey times of motorised vehicles between two sensors. To ensure driver anonymity, number plates are hashed on the sensor before being sent to a server for the journey time calculation.
Desired insight: Have updates to the Highway Code influence the speeds at which road users travel?
ZONAL SPEED
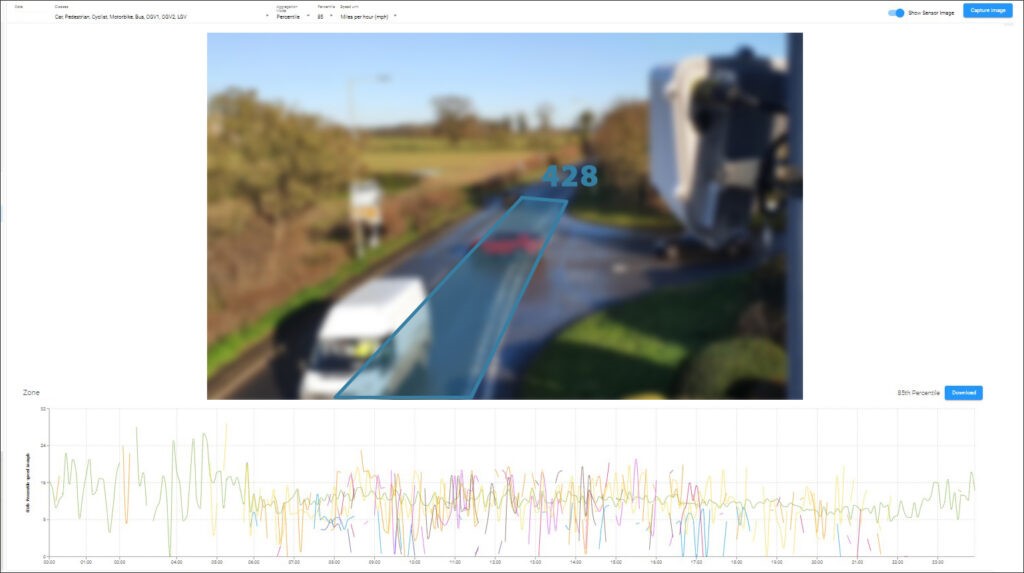
Gather average speed data of road users as they travel through a sensor’s field of view. Ascertain whether certain vehicle classes are travelling at unsafe speed and use the data to indicate opportunities for optimisation.
Desired insight: Has there been a change in the volume and duration of queues at junctions since Highway Codes updates have come into place?
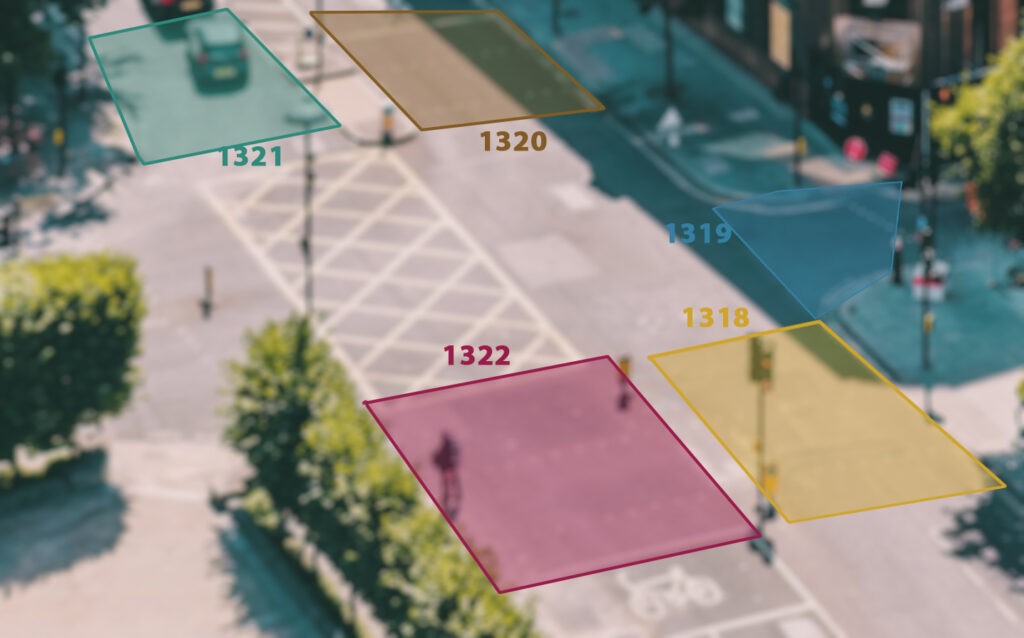
OCCUPANCY
Receive average counts of road users within a specified area of the sensor’s field of view which can be installed near to a junction. Start/stop driving behaviour has a much more detrimental impact to air quality than vehicles moving at steady speeds. Sensors can be integrated with urban traffic control systems to optimise modal signalling for more efficient junction operation.
There is a lot of speculation as to how the Highway Code updates will actually impact the network and if they will in fact make roads safer for vulnerable road users. Combining data insights will enable an in-depth understanding of road space use over time, before and after the introduction of the new rules, with 24/7 long term monitoring.