


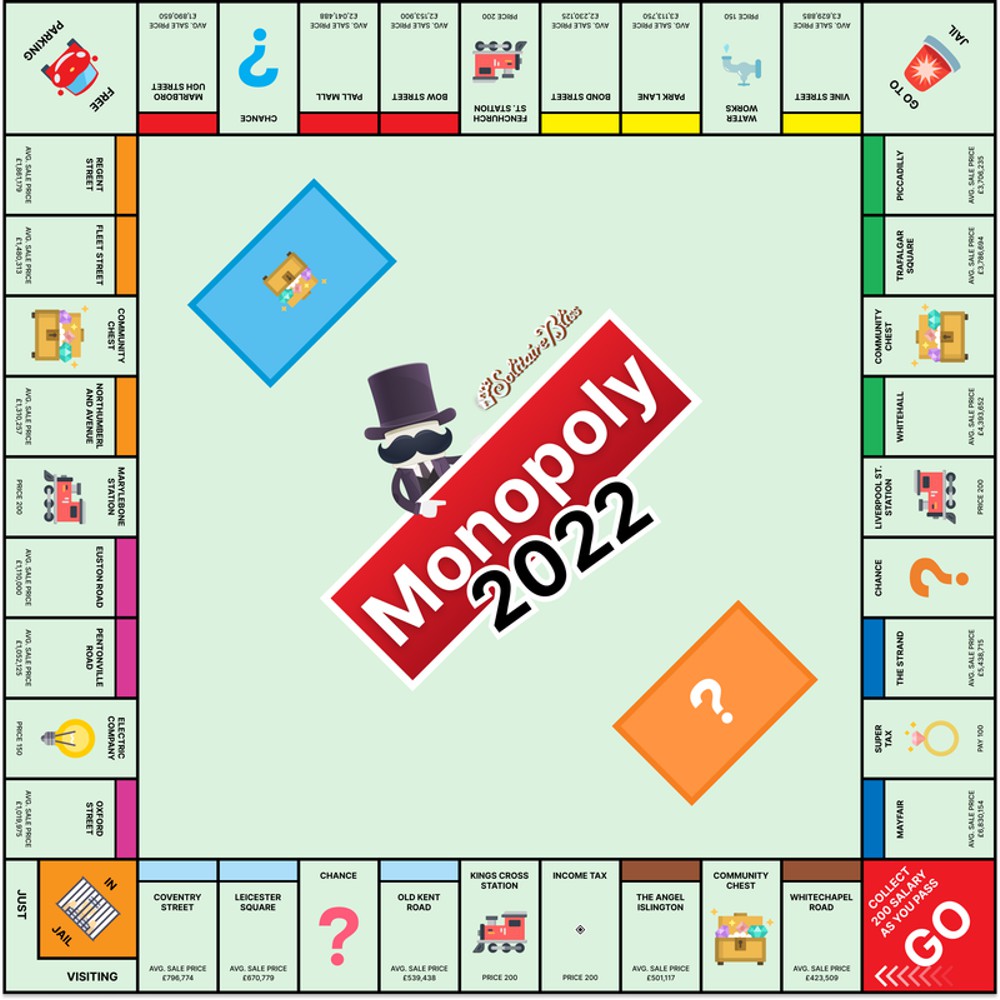
What would the Monopoly Board look like with modern house prices?
While the original 1935 order of the Monopoly board was loosely based on property values at the time, new research has revealed what the board could look like with modern property values.
The research by gaming experts SolitaireBliss analysed the average sale price of each area since 2015 to see what the order of the board would look like nowadays. It also looks at property size to see each area’s average ‘price per metre’.
It found that Mayfair still sits as the most expensive area with an average sale price of £6,830,154. Strand, which was once halfway down the board as a red tile, is now the second most expensive area, with an average sale price of £5,438,715. One of the most significant differences in Whitehall, which has now seen itself be moved 13 spots up the board to a green tile, with an average sale price of £4,393,652. Adjusted for inflation, 1935 prices would see Mayfair worth only £93,911, Strand worth only £74,799 and Whitehall worth only £60,410.
Whitechapel Road, The Angel Islington and Old Kent Road remain as the three cheapest on the board. Oxford Street, which was previously one of the most expensive tiles on the classic board, has been moved down 13 places, with an average sale price of £1,019,975. Coventry Street has also seen a significant reshuffle, being pushed down 11 spots to now be a light blue tile. Adjusted for inflation, a 1935 property in Oxford Street would cost you only £14,020 on average.
| Street | Average sale price | Average price per metre | Original order |
| Mayfair | £6,830,154 | £29,338 | Mayfair |
| Strand | £5,438,715 | £30,945 | Park Lane |
| Whitehall | £4,393,652 | £23,847 | Bond Street |
| Trafalgar Square | £3,786,694 | £23,964 | Oxford Street |
| Piccadilly | £3,706,235 | £28,958 | Regent Street |
| Vine Street | £3,629,885 | £34,276 | Piccadilly |
| Park Lane | £3,113,750 | £25,554 | Coventry Street |
| Bond Street | £2,230,125 | £21,311 | Leicester Square |
| Bow Street | £2,153,900 | £20,584 | Trafalgar Square |
| Pall Mall | £2,041,488 | £16,445 | Fleet Street |
| Marlborough Street | £1,890,650 | £17,628 | The Strand |
| Regent Street | £1,861,179 | £25,127 | Vine Street |
| Fleet Street | £1,480,313 | £21,101 | Marlborough Street |
| Northumberland Avenue | £1,310,257 | £15,168 | Bow Street |
| Euston Road | £1,110,000 | £12,658 | Northumberland Avenue |
| Pentonville Road | £1,052,125 | £17,311 | Whitehall |
| Oxford Street | £1,019,975 | £13,478 | Pall Mall |
| Coventry Street | £796,774 | £18,598 | Pentonville Road |
| Leicester Square | £670,779 | £11,950 | Euston Road |
| Old Kent Road | £539,438 | £10,261 | The Angel Islington |
| The Angel Islington | £501,117 | £6,706 | Whitechapel Road |
| Whitechapel Road | £423,509 | £8,998 | Old Kent Road |
In terms of looking at the average ‘price per metre’, The Angel, Islington comes in as having the lowest price per metre of £6,706. Whitechapel Road and Old Kent Road are the second and third cheapest. Vine Street has the highest price per metre with £34,276, along with Strand and Mayfair coming in second and third.
Commenting on the findings, a spokesperson from SolitaireBliss said: “What can be looked at as simply a modernisation of the legendary Monopoly board game, can also be viewed as an illustration of current house prices in the capital. It’s interesting to see how more commercial areas have seen huge changes with the likes of Oxford Street and Whitehall, whereas more residential areas such as Old Kent Road and Whitechapel Road have seen a steady and consistent with housing cost trends.”
This study was conducted by SolitaireBliss, an online gaming service with a wide array of card games and challenges available to play for free.
Just as the Monopoly board has undergone a modern makeover to appeal to contemporary audiences, classic card games like Solitaire have also evolved with the times. Platforms such as Zudoka offer an engaging digital experience of Solitaire, featuring various game modes, customizable appearances, and daily challenges. These modern adaptations provide both nostalgic enjoyment and fresh excitement for players of all ages.