


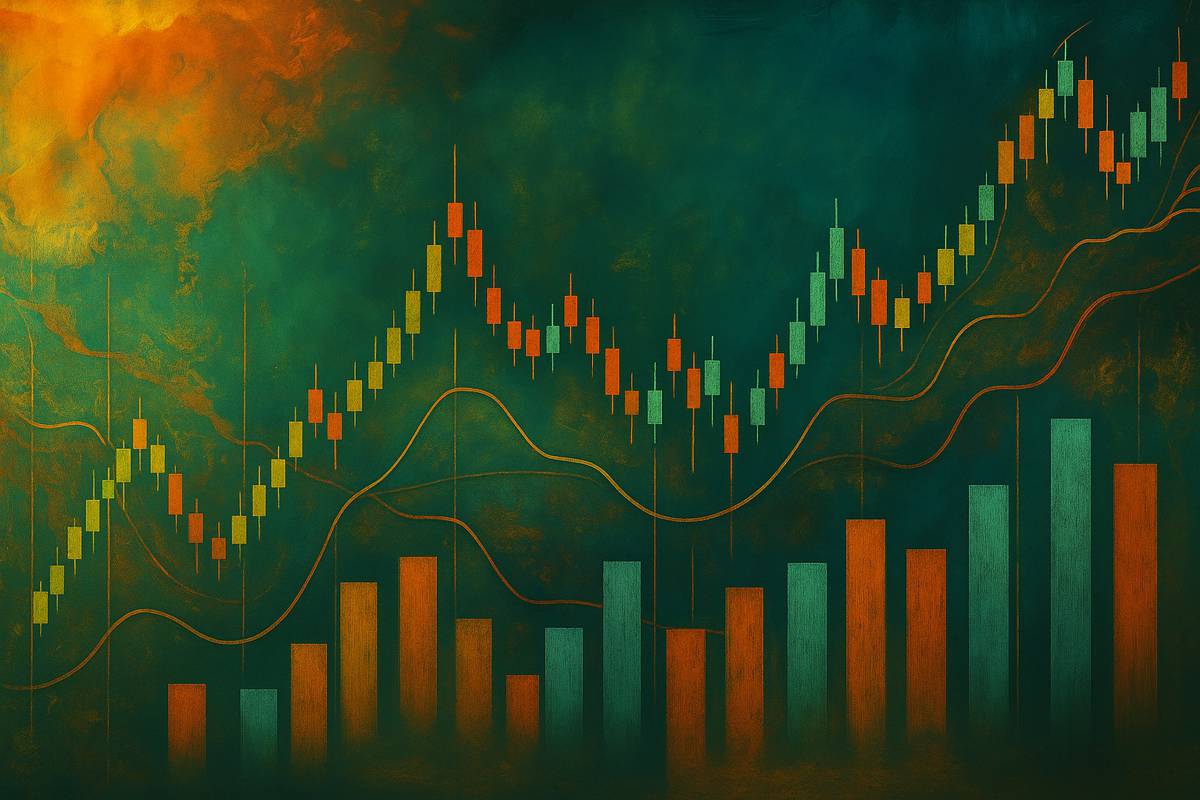
How to Read Charts for Day Trading: Visual Cues and AI-Enhanced Pattern Recognition Tools
Reading stock charts can feel overwhelming for many traders. Charts are full of patterns, indicators, and price movements that reveal a story about the market. This guide simplifies visual cues and explains how AI tools can make chart reading easier.
Keep reading to enhance your trading skills today!
Key Visual Cues for Reading Day Trading Charts
Day trading charts provide visual patterns that reveal potential price movements. Recognizing these signals helps traders predict market behaviour with greater confidence. If you’re still learning the fundamentals, this guide on how to read charts for day trading breaks down key chart elements and techniques in more detail.
Identifying Support and Resistance Levels
Support levels act as price floors where buying interest tends to increase, preventing further drops. Resistance levels serve as ceilings where selling pressure often intensifies, halting upward movement.
Traders use these levels to predict potential reversals or breakouts by analysing past price behaviour on charts.
Horizontal lines drawn at key high and low points highlight recurring support and resistance zones. Look for multiple touches in these areas without significant breaches. Substantial activity near these points strengthens their reliability for stock market trend analysis and trade management strategies.
Recognizing Trendlines and Channels
Trendlines connect a series of highs or lows, indicating the overall direction of price movement. Upward trendlines slope upward and show bullish strength, while downward lines indicate bearish pressure.
Clear trends assist traders in deciding when to enter or exit trades.
Price channels form between two parallel trendlines that encompass the majority of price movements. A rising channel often reflects steady gains, while a falling one suggests ongoing losses.
Breaking out from these channels may indicate significant opportunities for day trading decisions.
Spotting Reversal and Continuation Patterns
Reversal patterns indicate a potential change in the market’s direction. Look for formations like head and shoulders, double tops, or bottoms to spot shifts from bullish to bearish trends or vice versa.
Candlestick patterns such as morning stars and evening stars also signal reversals when combined with volume analysis.
Continuation patterns suggest the trend will persist. Watch for flags, pennants, or symmetrical triangles during price consolidations. These patterns often show decreased volatility before a breakout continues the prior trend.
Both pattern types depend on clear chart visualization and confirmation through technical indicators like RSI or moving averages.
Essential Technical Indicators for Day Trading
Traders rely on specific tools to analyse market movements and price behaviour. These indicators help identify opportunities in rapidly changing conditions.
Moving Averages
Moving averages smooth out price data to emphasize trends over time. Traders rely on them to determine the direction of market movements and possible entry or exit points. Simple moving averages (SMA) compute the average price over a set period, while exponential moving averages (EMA) place greater emphasis on recent prices for quicker responsiveness.
Short-term moving averages like the 10-day or 20-day assist in identifying immediate trends, while longer periods like 50-day or 200-day illustrate broader patterns. Intersections between short- and long-term moving averages often indicate trend reversals or confirmations.
For instance, a “golden cross,” where a short-term average rises above a long-term one, may suggest bullish momentum.
RSI and Momentum Indicators
RSI, or Relative Strength Index, measures the speed and extent of price movements over a specific period. Traders rely on it to recognize overbought (above 70) or oversold conditions (below 30).
Identifying these levels assists in anticipating potential price reversals in stock market trends. It also helps in detecting bullish or bearish signals during periods of significant volatility.
Momentum indicators are valuable for monitoring the rate of price changes rather than direction. Tools like the Moving Average Convergence Divergence (MACD) highlight changes in trend strength.
These aids are effective for identifying early entry points into trades or confirming breakout patterns when evaluating chart patterns for trading decisions.
Volume-Based Indicators
Volume-based indicators help traders validate price movements and identify potential trend reversals. Significant trading volume during a breakout often indicates stronger momentum, while low volume may suggest weaker continuation of trends.
Tools like the On-Balance Volume (OBV) or Volume Weighted Average Price (VWAP) demonstrate the strength of buyer-seller activity.
Sudden increases in volume can signal key moments for entry or exit opportunities. For example, if prices rise with increasing volume, it suggests growing optimistic sentiment. Conversely, falling prices paired with higher volume often signify bearish pressure.

AI-Enhanced Pattern Recognition Tools
AI tools help traders detect patterns, analyse trends, and interpret market behaviour with speed and precision.
Real-Time Candlestick Pattern Detection
Real-time candlestick pattern detection aids traders in recognizing bullish and bearish signals as they occur. AI-powered tools examine charts to identify formations such as doji, engulfing patterns, or hammer candles within moments.
These formations indicate changes in price trends and market sentiment.
Automating this process enables traders to evaluate multiple stocks at once without overlooking essential setups. The immediate identification of chart patterns minimizes reaction time and supports prompt entry or exit decisions in rapidly changing markets.
Automated Trendline and Breakout Analysis
AI simplifies stock chart analysis by identifying trendlines and breakout points with high accuracy. It detects price movement patterns and highlights key areas where a stock may break above resistance or drop below support.
These insights assist traders in predicting the continuation or reversal of trends without the need to manually draw lines on charts.
Automated tools monitor historical data, current price action, and volume changes to deliver precise technical analysis. They respond quickly to market fluctuations, providing real-time updates that aid in quicker trade decisions.
This application enhances day trading strategies and minimizes human errors during analysis.
Sentiment Analysis Integration
Sentiment analysis tools review news articles, social media posts, and financial reports to assess market sentiment. These tools categorize sentiments as positive, neutral, or negative, assisting traders in forecasting possible price changes influenced by public opinion.
Traders can analyse this data in combination with technical indicators like candlestick patterns for a more comprehensive understanding of market conditions.
By combining sentiment analysis with chart pattern recognition, day traders can more effectively predict upward or downward trends. This approach offers greater understanding of how external factors might affect stock prices.
Moving ahead, examine how visual cues and AI work together to support more informed decision-making in trading strategies.

Benefits of Combining Visual Cues with AI Tools
Using chart visuals with AI tools can simplify complex market data and improve analysis accuracy. Traders can act faster by spotting patterns and trends in real time.
Improved Decision-Making Speed
AI-powered tools analyze complex stock chart patterns in seconds, providing traders with practical insights. Algorithms detect key price movements like breakouts or reversals faster than manual analysis.
Visual cues combined with AI minimize hesitation during trades, enabling quicker reactions to market trends. Identifying bullish and bearish signals becomes more efficient, enhancing trade entry and exit timing.
Enhanced Accuracy in Pattern Recognition
AI tools enhance pattern recognition by analysing vast amounts of data promptly. They pinpoint candlestick patterns, such as doji, hammers, or engulfing patterns, with accuracy. This allows traders to detect bullish or bearish signals faster than manual methods.
AI also identifies subtle price movement trends that might be missed during traditional stock chart analysis.
Automated systems scan charts constantly to spot new breakout levels and trend reversals. These tools minimize human errors in technical analysis by emphasizing crucial visual cues for trading decisions.
By recognizing consistent chart patterns swiftly, traders can respond more assuredly to market changes.

Increasing Success
Mastering chart reading for day trading combines skill and strategy. Visual cues assist traders in identifying trends, patterns, and price movements. AI tools provide increased speed and accuracy to analysis, offering traders a distinct advantage.
Together, they refine decision-making and trade execution. With practice, these approaches can increase your success in the stock market.