






How Real-Time Traffic Data Helps Cities Spot Road Danger Earlier
Motor vehicle crashes cost far more than most people realize. In 2019 alone, the U.S. recorded $340 billion in crash costs, which works out to roughly $1,035 per person. And here’s the uncomfortable truth: much of the road safety work meant to prevent those crashes still relies on collision reports that may be weeks, months, or even years old by the time patterns become clear.
That reporting lag is a serious problem because severe risk tends to cluster in surprisingly few places. In Las Vegas, a data-driven review found that 77% of fatal injuries occurred on just 11% of the city’s roadways. If you’re a transportation planner waiting for enough crash history to pile up before doing anything about it, you’re almost certainly acting too late. Sound familiar?
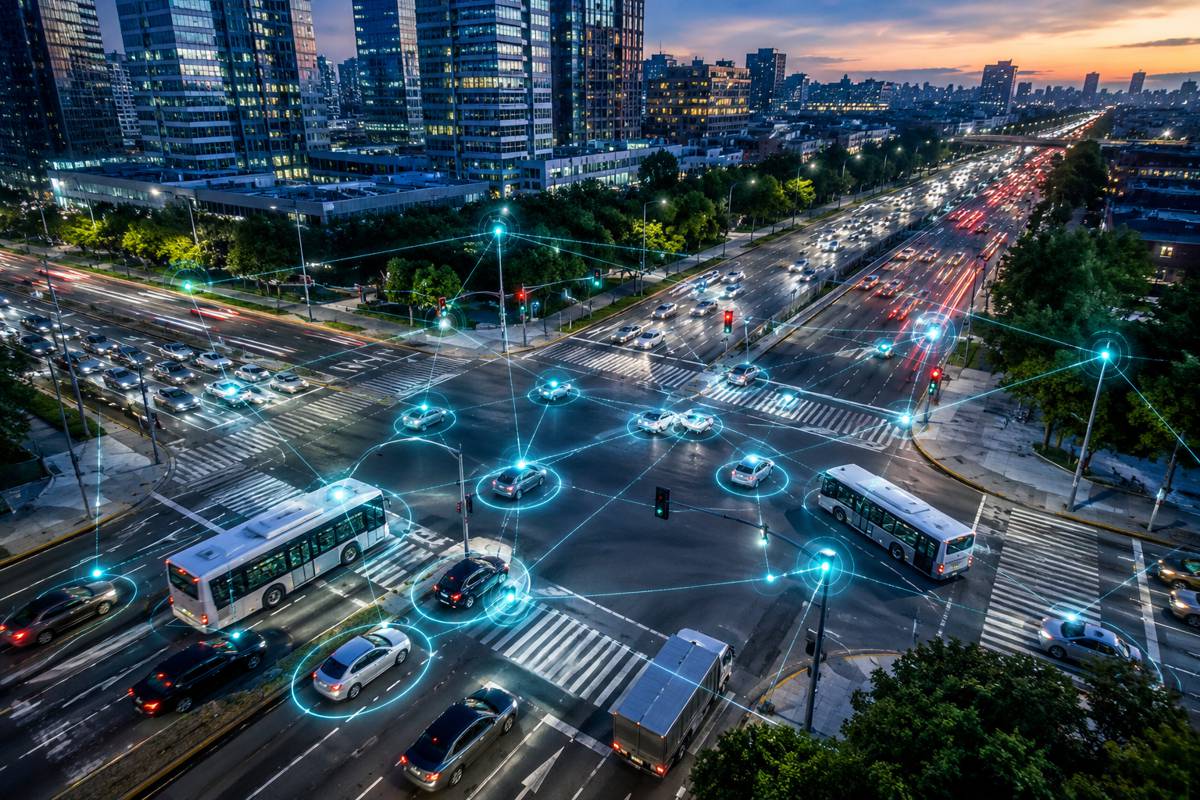
Agencies today can tap into live and near-real-time signals from cameras, connected vehicles, mobile location data, and signal systems. These feeds reveal unsafe speeds, near-miss conflicts, queue spillback, red-light-running exposure, and abnormal vehicle movements far sooner than traditional crash reports ever could. This guide explains how real-time traffic data is helping agencies shift from reactive collision analysis to earlier risk detection.
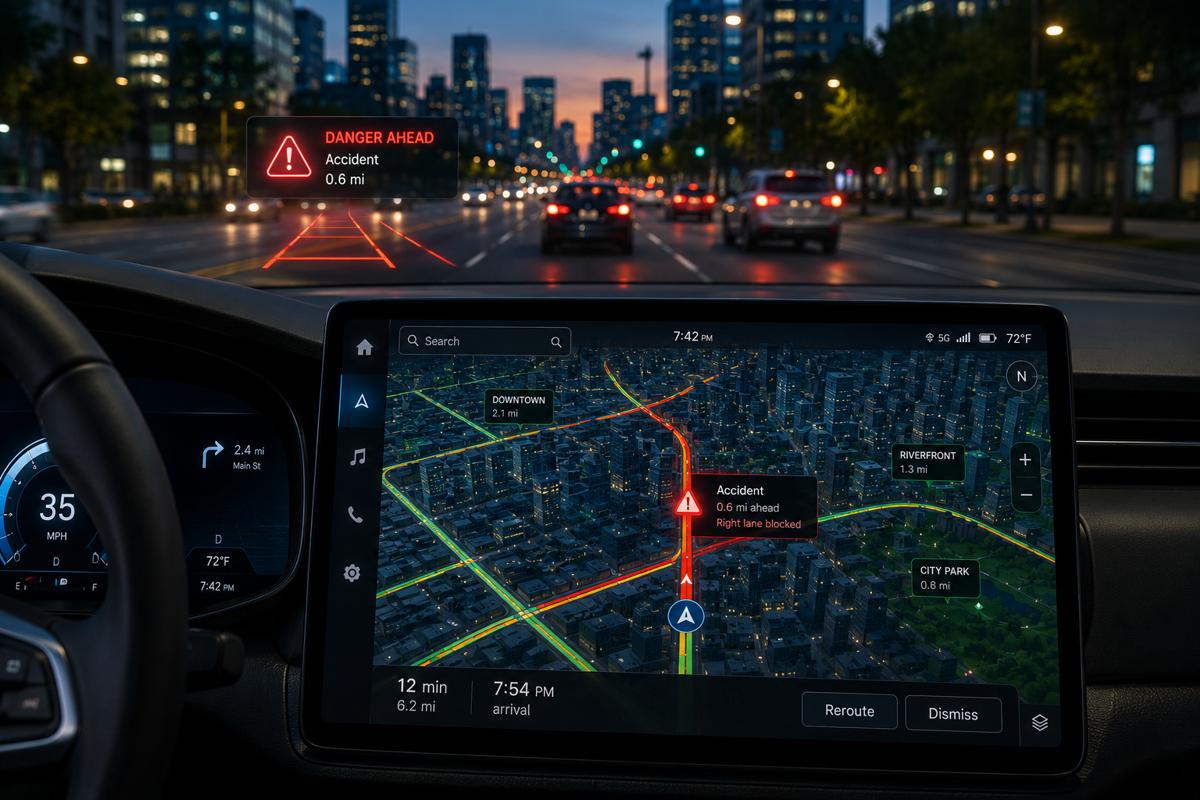
It also shows that while historical crash records remain necessary for validation, prioritization, and accountability, transportation professionals no longer need to wait for a tragedy to flag dangerous conditions. That urgency is underscored by the fact that V2X crash prevention technologies could eliminate or reduce the severity of up to 80% of crashes involving non-impaired drivers. When these live data feeds are connected properly, public agencies can deploy engineering countermeasures exactly when and where they’re needed most.
What Real-Time Traffic Data Means in Road Safety
From Reactive Crash Review to Proactive Risk Detection
Traditional safety management leans heavily on police collision records, hospital data, and annual network reviews to allocate engineering resources. Those lagging indicators remain essential for pinpointing severity patterns and legal reporting trends across road networks. But waiting for enough crashes to accumulate before taking action almost always means serious harm has already occurred.
Real-time safety data flips that dynamic by focusing on leading indicators; think of it like the difference between a smoke alarm and a fire damage report. Measurements such as speed variation, hard braking, near misses, turning conflicts with pedestrians, queue spillback, and sudden changes in traffic mix all signal an unstable road environment before a collision cluster occurs. Supporting this forward-thinking strategy, the AAA Foundation for Traffic Safety discovered that advanced driver-assistance systems (ADAS) could avert roughly 40% of all passenger-car collisions. That statistic alone illustrates how rapid, data-driven intervention can keep incidents from escalating into tragedies.
What “Real-Time” Actually Means in Practice
The definition of “real-time” varies depending on the technology and the specific safety application being deployed. Some tools are truly live, feeding operations centers or adaptive signal systems in real time so they can modify traffic flow on the spot. Others are near-real-time, updating hourly, daily, or weekly to provide a rapid snapshot of shifting mobility patterns. For traffic professionals, the practical question isn’t whether data streams are instantaneous; it’s whether they arrive quickly enough to support earlier engineering or operational action.
The impact of compressing that feedback loop can be dramatic. In Karachi, the introduction of modern traffic monitoring and management measures resulted in a 30% drop in fatalities within just six months. Shrinking the timeline between risk formation and agency response allows safety teams to make changes before an intersection establishes a fatal track record. You’ve probably seen it yourself if you’ve worked in traffic operations: by the time crash data confirms what field engineers already suspected, the damage is done.

The Data Sources Powering Earlier Risk Detection
So what’s actually feeding these earlier warnings? The answer isn’t a single magic sensor. It’s a mix of complementary data sources, each with distinct strengths and blind spots. Here’s a closer look at the five that matter most.
Video Detection and Intersection Monitoring
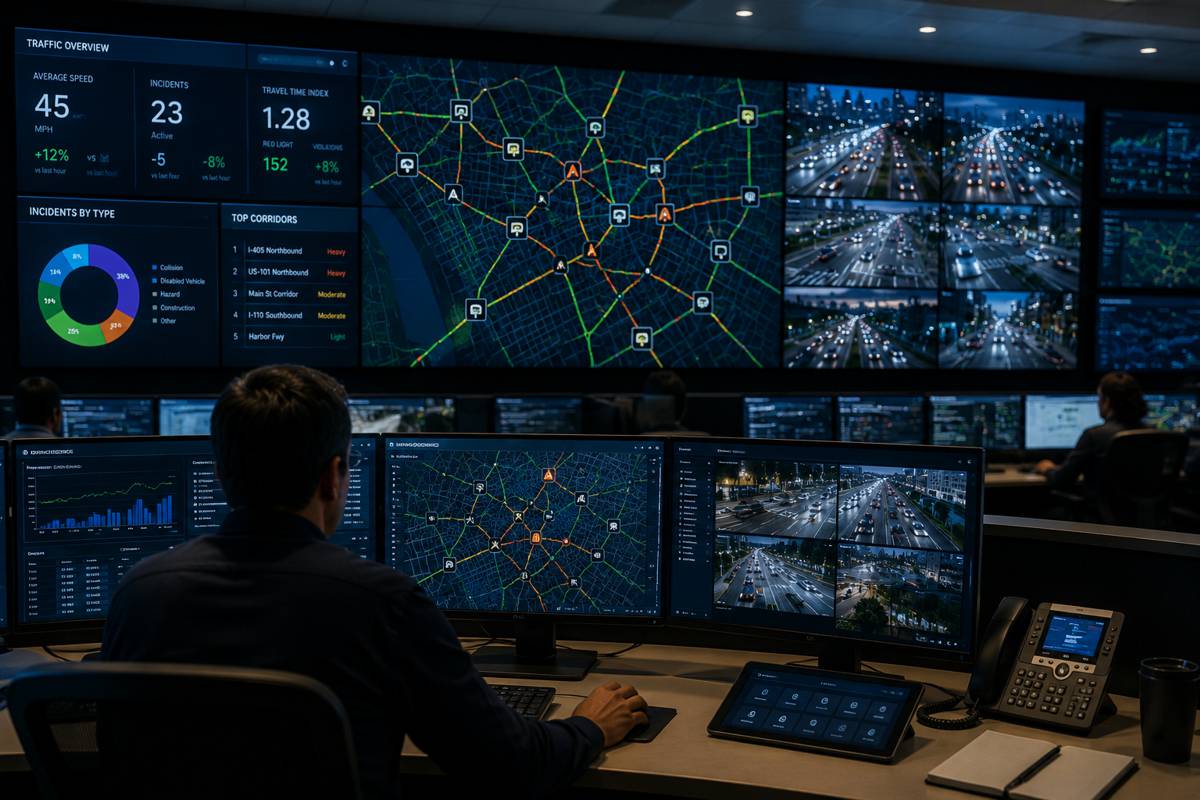
Camera-based systems can identify vehicles, pedestrians, cyclists, turning paths, dwell time, blocked lanes, queue lengths, and red-light-running exposure. These visual indicators are especially useful at intersections, where serious conflicts occur frequently. Cities often depend on this kind of field infrastructure to generate the operational data that underlies broader analytics platforms.
For example, solutions built around traffic detection management that bundle video detection, intersection monitoring, 24/7 multimodal counts, and signal performance measures can help agencies capture both current and historical activity involving vehicles, pedestrians, and cyclists at the approach level. That intersection infrastructure doesn’t replace crash analysis or connected vehicle feeds, but it strengthens the evidence base for where conflicts, delays, missed detections, or unusual turning behavior are occurring at signalized locations. It acts as one component of a wider road safety analytics framework.
Continuous monitoring highlights when driver behavior starts to degrade, giving traffic engineers a window to intervene proactively. A pilot project in Pittsburgh using AI-based adaptive signals reduced travel times by 25% and cut idling by more than 40%. Reducing idle time and intersection delay also lowers the likelihood of rear-end and right-angle collisions, which is great news if you’re managing a signalized corridor with a troubling crash history.
Connected Vehicle and Telematics Data
Connected vehicle data provides location traces, speed profiles, acceleration rates, harsh braking events, cornering metrics, and even wiper status from equipped vehicles. A recent report from Agilysis details the potential for intelligent transport systems and connected vehicle data to help authorities identify risks before collisions occur. This information is particularly useful for corridor-level screening and network-wide trend detection, surfacing risky behaviors well before crashes accumulate.
Replica and Arity recently launched Safety Hub, a platform that combines driving data from over 50 million active connections with government crash data to locate high-risk areas. Meanwhile, Danbury, Connecticut, is using AI-powered traffic analytics along with connected vehicle telemetry and GPS-based traffic data to estimate traffic speeds, congestion patterns, and roadway usage across its network.
Mobile Mobility and Location Data
Mobile data provides origin-destination patterns, route choice, travel demand shifts, and exposure estimates for transportation planners. This context helps understand how many people use a corridor, at what times, and whether risk changes simply because activity patterns shift. StreetLight Data has been promoting its mobility analytics tools, highlighting their ability to identify speeding hotspots, monitor vehicle volumes, and evaluate project impacts across networks.
In the Philadelphia metro area, the firm used analyses of vehicle speeds and biking and walking volumes to assess active transportation safety. Local governments are increasingly adopting these tools, too. MetroPlan Orlando is currently considering a $200,000 contract extension for StreetLight Data to evaluate traffic volumes, speeds, and turning movements. Connecting mobility context to actual roadway events enables safety teams to prioritize infrastructure upgrades with greater precision than annual counts alone could ever provide.
Police Collision Records and Official Crash Databases
Even as predictive tools advance, police collision records remain foundational for severity tracking, legal accountability, trend baselines, and network screening. They provide the “ground truth” on harm outcomes, serving as the basis for grant justifications and equity reviews. Transport agencies rely on these official databases to confirm where severe injuries and fatalities actually happen.
In Ireland, the Road Safety Authority recently launched an interactive collision map containing data on fatal, serious, and minor injury collisions on public roads between 2016 and 2024. The map will be updated annually, showing how historical records provide a transparent baseline for public analysis. Comparing real-time alerts with these permanent records helps ensure that municipal safety investments align with actual harm patterns rather than algorithmic guesswork.
Signal Performance Measures and Operational Data
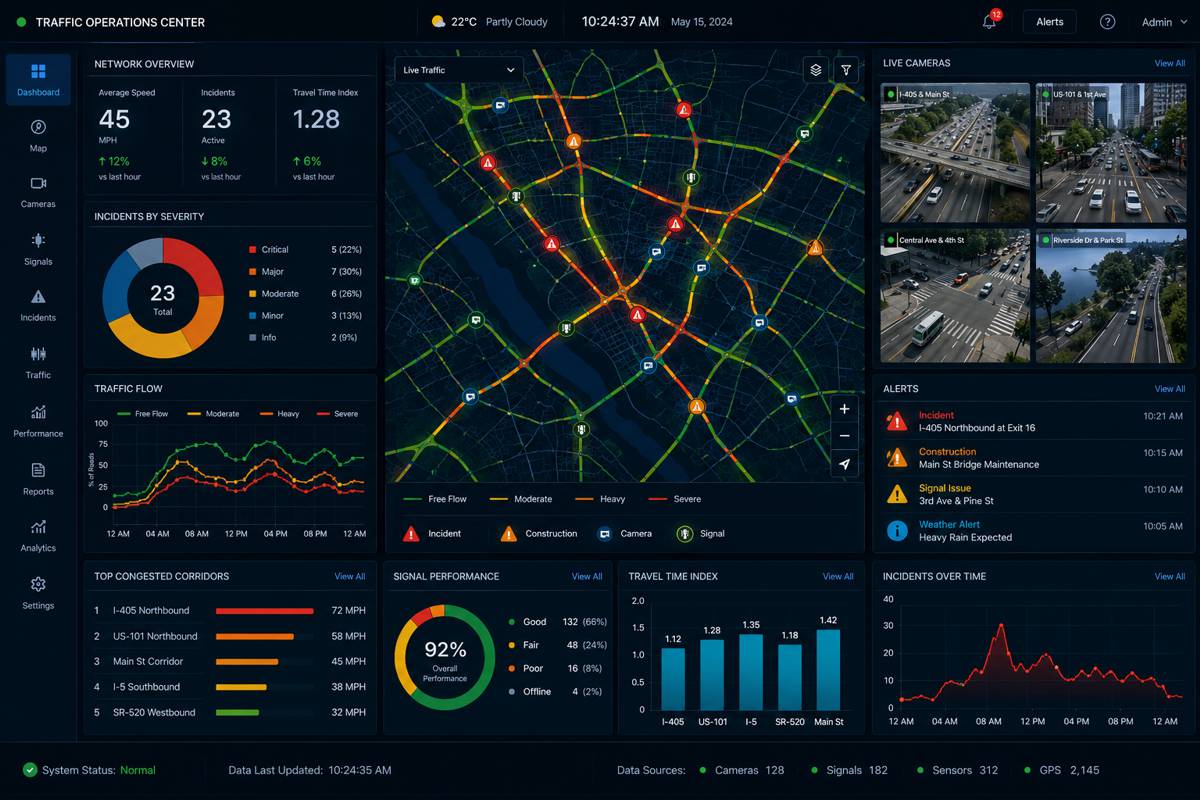
Advanced Traffic Signal Performance Measures (ATSPM) cover split failures, detector health, red occupancy, cycle failures, queue patterns, and progression failures. At first glance, these metrics don’t look like traditional safety data. But they often signal unstable operations, driver frustration, and risky behavior at junctions. Ask any traffic engineer who’s spent time reviewing ATSPM dashboards, and they’ll tell you: operational dysfunction and crash risk tend to travel together.
Fixing these operational bottlenecks directly affects both safety and network efficiency. The Institute of Transportation Engineers estimates that traffic signal retiming can yield a 40:1 benefit-to-cost ratio. On top of that, the U.S. Department of Transportation notes that advanced traffic management strategies can increase network capacity by up to 22% and throughput by up to 7%. Improving signal progression reduces the erratic stopping and starting that so often leads to intersection collisions.
| Data Source | What It Detects Best | Main Strength | Main Limitation | Best Use Case |
| Video detection | Turning conflicts, queues, multimodal activity, red-light-running exposure | Rich intersection detail | Privacy and governance complexity | Junction safety review |
| Connected vehicle data | Speeding, harsh braking, abnormal maneuvers, corridor risk | Wide network coverage | Sample bias and vendor dependence | Network screening |
| Mobile mobility data | Travel demand, route shifts, exposure context | Strong planning context | Less direct on conflicts | Corridor and land-use analysis |
| Police collision records | Injury severity, crash type, historic patterns | Outcome-based evidence | Time lag and underreporting | Funding, prioritisation, accountability |
| Signal performance measures | Split failures, detector issues, progression, queues | Direct operations insight | Mostly limited to equipped intersections | Signalised safety operations |
Where Real-Time Tools Are Adding Value Now
You’ve now seen the data sources. Here’s where they’re making a tangible difference on the ground.
Speed and Hotspot Detection Before Crash Clusters Appear
Speed management is one of the strongest early-warning use cases because excessive or inconsistent speed is a leading risk factor, especially on arterials. StreetLight’s analysis of speeds along proposed routes for a shared-use path, for instance, allows agencies to identify where additional safety measures are necessary before a project breaks ground. Danbury’s investment in AI-powered traffic analytics (including traffic-calming, speed-study, and mobility tools) takes a similar approach to curb dangerous driving on local roads.
Identifying daily speed variance rather than waiting for annual reports enables municipalities to deploy targeted enforcement or temporary traffic calming measures quickly. Picture a mid-size city that notices a 15% spike in 85th-percentile speeds along a school corridor over two weeks; with daily data, they can put up a temporary speed board or request enforcement before a child is hit. Catching velocity changes before they result in clustered severe crashes helps preserve lives and protect local community connectivity.
AI-Assisted Operations at Intersections and Corridors
Artificial intelligence accelerates the processing of live data, enabling systems to continuously adjust traffic operations. Goyang City in South Korea recently began full-scale operation of an AI-based signal system at seven intersections, where pilot operations adjusted signal timing by a minimum of 26 seconds. In the UAE, Dubai Police use an AI traffic monitoring system that continuously analyses live traffic data, including vehicle volumes, speeds, and movement patterns, to proactively identify risks before incidents escalate.
By automating responses to changing field conditions, these operational setups can reduce congestion, which often contributes to rear-end crashes. Active intervention also creates a smoother driving environment, discouraging aggressive maneuvering that often leads to intersection fatalities. Not where you’d expect the safety payoff to come from, right? But less congestion really does mean fewer conflicts.
Predictive Safety Platforms That Combine Multiple Datasets
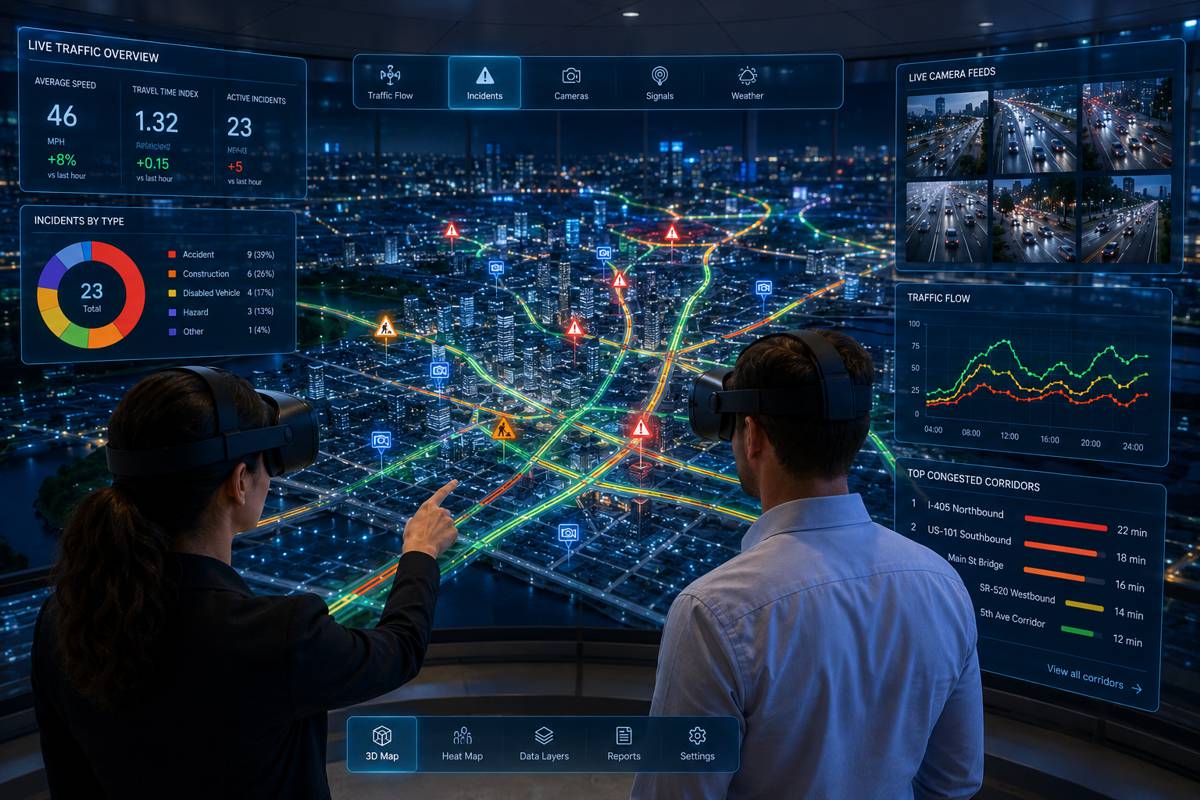
The most sophisticated applications now blend multiple data streams to generate predictive risk scores. Safer Highways notes that the use of predictive analytics in operations is a significant step forward in understanding what’s likely to happen next on the network. The Replica and Arity Safety Hub exemplifies this by combining mobility data with driving patterns to help public agencies identify high-risk areas and improve safety outcomes over time.
To build an accurate baseline of standard operations, these forecasting models process millions of daily data metrics. When real-world conditions deviate from that baseline, the platform can quickly alert transportation officials to emerging dangers. So what does this actually mean for you if you’re running a safety program? It means you can flag a corridor for review before it shows up in next year’s crash report.
The use cases where this layered approach delivers the most value include:
- Signalized intersections, where delay, missed detections, and turning conflicts can be measured continuously rather than sampled once a year
- High-injury corridors, where speed and hard-braking patterns can reveal emerging risk before severe crashes pile up
- Work zones and temporary traffic changes, where conditions shift too quickly for annual crash reviews to keep pace (and yes, there’s a catch: sensor coverage in work zones is often spotty)
- Special events or seasonal peaks, where travel demand changes can alter exposure and conflict patterns within days
Where Historical Crash Data Still Matters Most
Why Cities Shouldn’t Abandon Traditional Collision Analysis
Cities must maintain traditional collision analysis because crash records measure actual harm, not just proxies for danger. Severe and fatal collision patterns remain the fundamental basis for Vision Zero accountability and federal grant applications. Historical data provides the necessary baseline for rigorous before-and-after studies and for evaluating infrastructure policy.
Ongoing statistics from the Department for Transport reveal sustained levels of severe injuries and fatalities on British roadways, underscoring the need to monitor concrete safety outcomes even alongside sophisticated predictive modeling. On top of that, underrepresented road users may not be fully visible in some live mobile datasets, underscoring the importance of hospital and police injury records for maintaining equity in transportation planning. If your live data feeds don’t capture the cyclist who was struck on a road with no connected-vehicle coverage, the crash report is the only record of that harm. Historical data anchors safety strategies in verifiable reality.
The Strongest Approach Is Layered
Best practice doesn’t pit predictive models against historical data; it layers them together. Historical crash data identifies where serious harm has concentrated over time, while real-time data pinpoints where current operational conditions suggest risk is actively climbing. Engineering judgment then determines what intervention is proportionate based on this combined evidence base.
Dubai Police explicitly models this approach, as their system combines real-time data with historical records to identify risky trends and locations that may require intervention. Follow-up evaluation then confirms whether changes successfully altered the risk trajectory. Connecting these datasets creates a defensible framework for major infrastructure spending, which matters enormously when you’re justifying a multimillion-dollar corridor redesign to elected officials and taxpayers.
Governance, Privacy, and Procurement Issues Cities Need to Address
So far, you’ve covered the data and the use cases. Here’s where things get more complicated: the governance side.
Privacy, Data Minimization and Public Trust
With the deployment of optical and connected sensors, local authorities must address public concerns about surveillance. According to GovTech, privacy advocates have raised concerns about the privacy of visual data collected by AI-powered technology. Agencies need to define the exact purpose before collecting data, limit retention periods, and strictly control access permissions.
They should also, where possible, separate traffic operations from unrelated surveillance uses and audit AI outputs to maintain public trust. Transparent data policies help assure residents that safety improvements won’t compromise civil liberties. Without that assurance, you risk a public backlash that can stall or kill a program entirely, regardless of how strong the safety case is.
Data Quality, Bias, and Representativeness
Decision-makers need to scrutinize the representativeness of their incoming feeds. Connected vehicle data may overrepresent newer cars, commercial fleets, or app-enabled users, skewing the overall picture of driver behavior. Mobile data can underrepresent certain demographic groups or specific short trip types, while video analytics can perform unevenly in poor weather, low light, or complex mixed-traffic conditions.
The autonomous sector reveals similar complexities. Despite reports that Waymo vehicles have obstructed emergency operations, the company maintains it has reduced emergency calls involving passengers by over 50%, demonstrating that interpretations of data can vary sharply depending on the source. Police records also inherently undercount non-injury and near-miss events. The takeaway? No single data stream offers a flawless picture of roadway danger. Treating any one source as ground truth is a recipe for blind spots.
Interoperability and Procurement
Procuring new data platforms requires agencies to prioritize interoperability to avoid vendor lock-in. Cities need to ask whether data can be exported via open APIs and whether the system connects cleanly with signal controllers, ATSPM tools, GIS platforms, and existing road safety dashboards. They also need to determine whether they own the raw data, the derived insights, or merely a subscription view.
Establishing these contractual details early is just as vital as the technical requirements. Open standards help prevent public funds from being trapped in proprietary, closed-loop ecosystems; something that’s happened more often than most transportation departments like to admit.
Safer Roads Depend on Faster Signals, Not Just Better Reports
Road safety teams no longer need to wait for annual collision reviews to detect many emerging risks on their networks. Real-time and near-real-time data can expose dangerous speeds, unstable operations, and multimodal conflicts much earlier in the risk lifecycle. But the most credible and effective safety programs combine these live indicators with historical crash outcomes and strong governance frameworks.
As road networks become increasingly connected, agencies that link field detection, operational data, and sophisticated safety analytics will be better positioned to implement Vision Zero principles that aim to eliminate road deaths by 2030 and ultimately by 2050. Combining rapid detection with sound engineering judgment remains the surest path toward a transportation system that doesn’t accept fatalities as the cost of mobility.