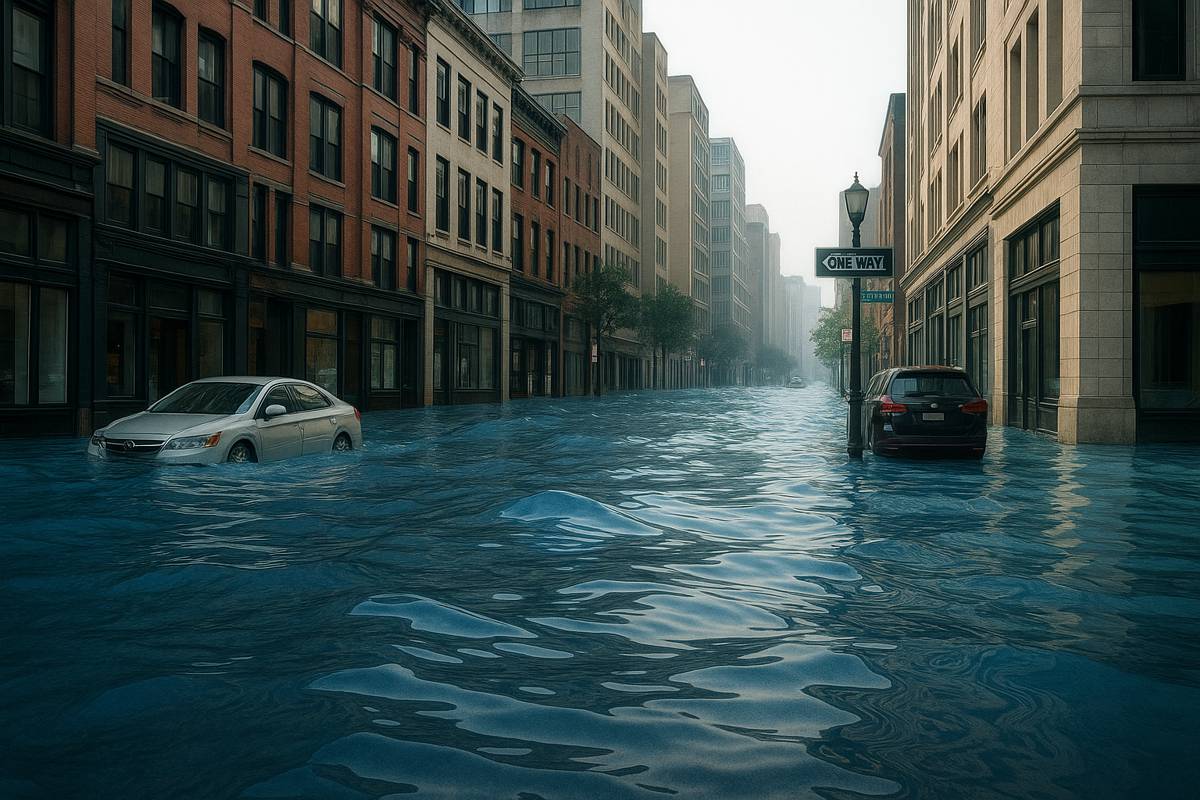


Seeing the Flood Before It Hits with 3D Visualisations
As climate change tightens its grip and extreme weather events become the new norm, how we communicate flood risks has never been more critical. Traditional static flood maps, while useful for planning, often fall flat when it comes to convincing people on the ground to take immediate action. But thanks to a ground-breaking research effort spearheaded by New York University (NYU), there may be a better way to bridge that gap. And it’s not just better; it’s transformative.
Two recent studies conducted by NYU researchers in collaboration with institutions in Ireland and the UK reveal that dynamic 3D flood visualisations are a game-changer in risk communication. In a community trial in Sunset Park, Brooklyn, a staggering 92% of participants preferred 3D simulations over conventional 2D flood maps.
“The challenge we face is that substantial sectors of the population ignore flood warnings and fail to evacuate,” explained Professor Debra F. Laefer, a senior researcher at NYU Tandon School of Engineering and co-author of both studies. “Our findings suggest dynamic 3D visualisations could significantly improve how we communicate these life-threatening risks.”
Intuitive Technology, Tangible Impact
So, what makes these 3D visualisations tick? Unlike high-cost systems that demand fancy GPUs and specialised software, the team created an intuitive, low-cost method that uses LiDAR scans to produce immersive simulations. Detailed in the journal Remote Sensing, their work proves that technical sophistication doesn’t have to come with a hefty price tag.
Instead of relying on expensive rendering engines, the team deployed a Potree viewer and Inkscape to model water flow using sine wave functions. The simulation mimics real-life water behaviour with algorithms governing flow speed, transparency, and colour intensity.
“We achieved this using a Potree viewer coupled with Inkscape to create dynamic flood water flow,” said Laefer. “Our study didn’t require a graphics card — just a single, quad-core processor.”
The Sunset Park Experiment
The second study, published in Progress in Disaster Science, pitted a NOAA 2D flood map against a dynamic 3D simulation of floodwaters rising three feet at a major intersection in Sunset Park. The participants, many of whom were immigrants with limited English proficiency, responded strongly to the visual clarity of the 3D approach.
Not only did 100% of them say the 3D version was more authoritative, but they also reported a significantly deeper understanding of the potential dangers. “One of the most rewarding aspects was seeing how participants instantly grasped the flood severity without technical explanations,” said Kshitij Chandna, a former NYU master’s student and co-author on both studies. “When someone looks at a 3D simulation and says ‘I would need to evacuate,’ you know you’ve successfully communicated risk in a way traditional maps cannot.”
Communicating Across Language and Literacy Barriers
In neighbourhoods like Sunset Park, where many residents come from immigrant backgrounds and face language barriers, the need for clear, immediate communication is urgent. Traditional maps with labels and contour lines often assume a baseline of technical literacy. These dynamic 3D visualisations cut through that.
Participants repeatedly used terms like “more realistic,” “clearer,” and “more visual” when describing their experience with the simulations. It’s a form of communication that transcends language — and that’s no small feat when seconds count.
From Streets to Pipes
While the spotlight is on flood risks for now, the technology’s potential stretches far beyond. The research team has already started experimenting with simulations of water moving through underground pipes. There’s talk of adapting the same approach to other types of flooding — storm surges, sewer overflows, even urban runoff scenarios.
What’s compelling is how flexible the system is. Because it separates the flood prediction process from the visual rendering, it doesn’t hog processing power. That opens the door for widespread use, including in schools, community centres, and emergency services training.
Research Backing with Global Reach
The brainpower behind these innovations is as international as it is interdisciplinary. In addition to NYU Tandon and NYU Steinhardt, collaborators include University College Dublin and Queen’s University Belfast. The papers represent a new wave of academic research that’s deeply applied.
The authors include Debra Laefer, Kshitij Chandna, Evan O’Keeffe, Kim Hertz (NYU Tandon); Jing Zhu and Raul Lejano (NYU Steinhardt); Anh Vo and Michela Bertolotto (University College Dublin); and Ulrich Ofterdinger (Queen’s University Belfast). The second paper also lists Peter Gmelch among the contributors.
Notably, the project received funding from the United States National Science Foundation, bolstering its legitimacy and potential for scalability.
An Urgent Tool for a Climate-Driven Future
With sea levels rising and flood events becoming more frequent, this type of communication innovation isn’t just academic. It’s vital. The hope is that city planners, disaster response agencies, and local governments take note — and take action.
As Laefer sums it up: “This is about more than data visualisation; it’s about saving lives.”
A Path Forward with Visual Clarity
In a world where climate change is rewriting the rulebook on disaster preparedness, the need for effective communication tools has never been more pressing. These 3D simulations are not just pretty pictures; they are lifelines.
By helping people see the danger before it arrives, this technology empowers communities to act swiftly and decisively. And when lives hang in the balance, that clarity is priceless.