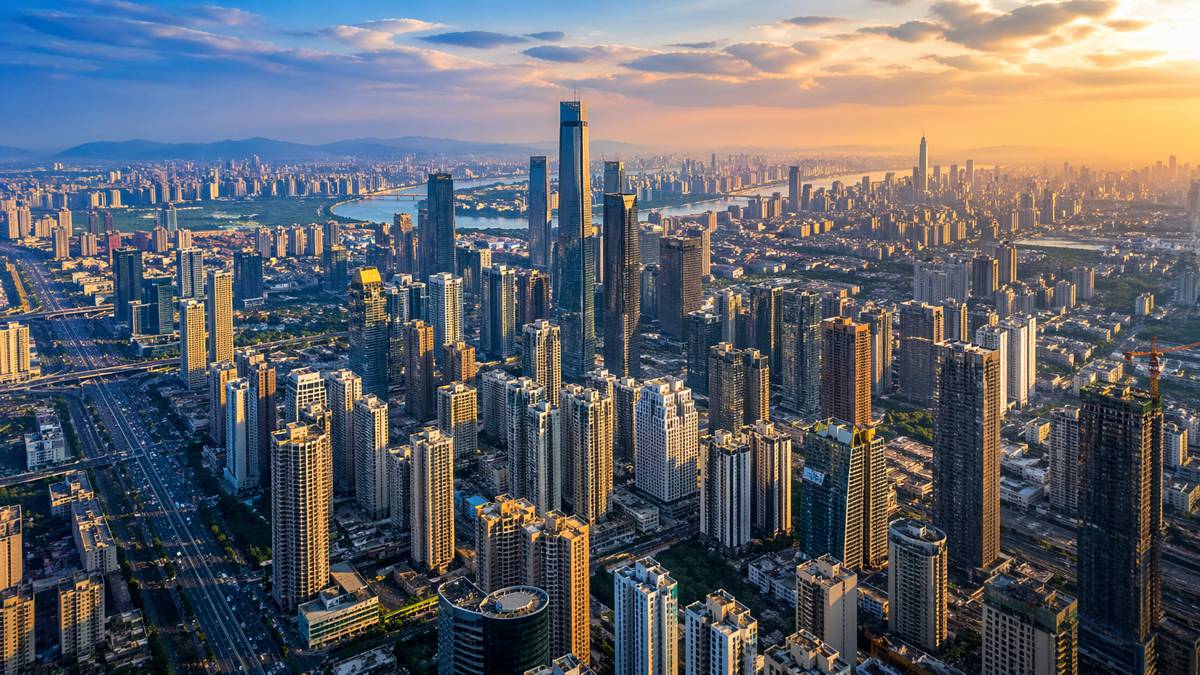


Mapping the Rise of Cities in Three Dimensions
Cities don’t just spread, they climb. Yet for decades, most global urban analysis has focused almost entirely on horizontal expansion, tracking how far cities push into surrounding land. That approach, while useful, leaves a sizeable blind spot. The vertical dimension of urban growth, how buildings stack, cluster, and intensify over time, shapes everything from infrastructure demand to carbon emissions, yet it has remained frustratingly difficult to measure at scale.
Now, a major international research collaboration led by China Agricultural University alongside Tsinghua University, The University of Hong Kong, Curtin University, University of California Berkeley, Sun Yat Sen University and Southwest Jiaotong University has taken a significant step towards solving that problem. Their study, published in the Journal of Remote Sensing in March 2026, reconstructs more than two decades of global built-up height and volume, offering one of the most comprehensive views yet of how cities have grown vertically since the mid-1990s.
Rather than treating cities as flat, two-dimensional footprints, the research reframes urbanisation as a three-dimensional process. That shift matters. Height and volume influence urban heat retention, airflow, energy demand, transport planning, and even disaster resilience. Strip those out of the equation and the picture of urban growth looks incomplete, if not misleading.
Briefing
- Global built-up volume rose from 273.09 km³ in 1995 to 931.17 km³ in 2018, a 2.4-fold increase
- Asia recorded the fastest vertical growth, with the Global South expanding roughly twice as fast as the Global North
- A multi-satellite calibration approach improved temporal consistency from 0.87 to 0.97 across 24 regions
- The study integrates radar data with GAIA impervious surface datasets to improve accuracy
- Results achieved strong validation metrics, including RMSE as low as 0.32 m against reference datasets
A New Lens on Urban Growth
For planners, engineers and policymakers, the implications are immediate. Cities that grow upwards place very different demands on infrastructure compared to those that sprawl outwards. High-rise clusters alter wind patterns, concentrate energy use, and require more complex transport and utility systems. Yet until recently, consistent long-term global data on building heights simply did not exist.
The challenge has been technical. Satellite systems capable of measuring surface characteristics have evolved over time, each using different radar bands, resolutions, and calibration methods. Comparing data from one system to another across decades has been, to put it mildly, messy. Without a consistent baseline, tracking change becomes guesswork.
The research team tackled this head-on by harmonising data from three major radar satellite systems: ERS, QSCAT and ASCAT. Each brought its own strengths and limitations, but the real breakthrough came from aligning them into a single, temporally consistent dataset. That alone marks a significant methodological advance, opening the door to long-term comparative analysis on a global scale.
Engineering Consistency Across Satellite Systems
Getting different satellite systems to “speak the same language” is no small feat. QSCAT, for instance, operates on a different radar band compared to ERS and ASCAT, meaning its raw observations can’t be directly compared without adjustment. The researchers addressed this using a second-order regression model, calibrated over overlapping observation periods.
The results were striking. Temporal consistency across 24 global regions improved from 0.87 to 0.97, a level of alignment that significantly strengthens confidence in long-term trend analysis. In practical terms, that means changes observed in the dataset are far more likely to reflect real-world urban growth rather than artefacts of shifting sensor technology.
From an infrastructure intelligence perspective, that consistency is gold dust. Reliable long-term datasets underpin everything from investment planning to climate modelling. Without them, decision-making tends to lean on short-term snapshots, which can obscure underlying trends.
Integrating Surface Data to Refine Accuracy
Satellite radar alone doesn’t tell the full story. Urban environments are complex, with vegetation, water bodies, and non-built surfaces all influencing backscatter signals. To refine their estimates, the researchers integrated impervious surface data from the GAIA dataset, effectively filtering out non-urban interference.
This adjustment significantly improved model performance. The impervious surface area adjusted model achieved an R² of 0.89 and an RMSE of 0.21, outperforming non-adjusted approaches. Final height estimates showed strong agreement with reference datasets, with RMSE at 1.42 metres and mean absolute error at 0.86 metres.
Cross-validation against existing global datasets such as GBH and GUH3D reinforced these findings, with RMSE values ranging between 0.32 and 0.37 metres. For a dataset spanning more than two decades at global scale, those figures represent a high level of reliability.
The Scale of Vertical Urban Expansion
The headline numbers tell a compelling story. Global built-up volume increased from 273.09 cubic kilometres in 1995 to 931.17 cubic kilometres in 2018. That’s not incremental growth, it’s structural transformation. Cities are not just getting bigger, they’re becoming denser and more vertically complex.
Asia stands out as the primary driver of this growth, reflecting rapid urbanisation across countries such as China and India. More broadly, the Global South is outpacing the Global North, with relative growth rates roughly double those seen in more mature economies.
That divergence has real-world implications. Rapid vertical expansion in developing regions often occurs alongside infrastructure constraints, creating pressure on transport networks, utilities, and housing systems. Understanding where and how this growth is happening becomes critical for planning sustainable urban futures.
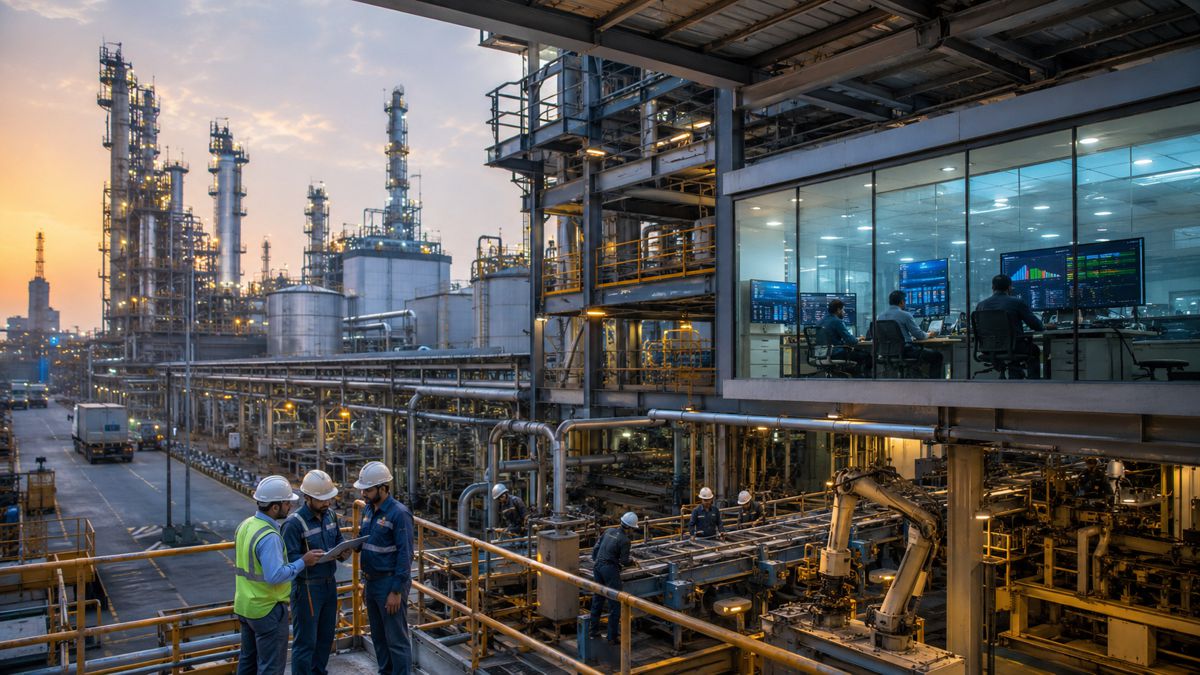
Implications for Infrastructure and Energy Systems
Vertical growth changes the rules of the game for infrastructure. High-density urban environments require more sophisticated energy distribution systems, more resilient transport networks, and more efficient land-use strategies. They also tend to concentrate emissions, making them both a challenge and an opportunity for decarbonisation efforts.
Research in urban energy systems consistently shows that building form and density influence energy consumption patterns. High-rise buildings, for instance, often require more energy for cooling, vertical transport, and lighting, though they can also benefit from efficiencies of scale. Without accurate data on building height and volume, modelling these dynamics becomes far less precise.
The dataset produced by this study offers a foundation for improving those models. By linking vertical growth patterns with energy use and emissions data, analysts can develop more nuanced insights into how urban form drives environmental outcomes. That, in turn, supports more targeted policy interventions.
Climate and Urban Heat Considerations
Urban heat islands are another area where vertical data makes a difference. Tall, dense clusters of buildings trap heat, reduce airflow, and alter surface reflectivity, leading to higher local temperatures. These effects are already well documented, but quantifying them at global scale has been challenging.
With long-term height and volume data, researchers can begin to map how vertical growth correlates with temperature changes over time. That opens up new possibilities for designing mitigation strategies, from green roofs to improved urban ventilation corridors.
Given the increasing frequency of extreme heat events worldwide, particularly in rapidly urbanising regions, this kind of insight is more than academic. It feeds directly into public health planning, energy demand forecasting, and climate resilience strategies.
Strengthening Urban Modelling and Policy
Urban modelling has long relied on assumptions about density and building form. While those assumptions have improved over time, they often lack the granularity needed for precise forecasting. A globally consistent, long-term dataset on built-up height changes that equation.
Planners can now assess not just where cities are growing, but how that growth is structured vertically. Investors gain a clearer picture of development intensity, which can inform decisions around real estate, infrastructure, and utilities. Policymakers, meanwhile, can align urban development strategies with sustainability goals more effectively.
It’s also worth noting that this dataset arrives at a time when digital twins and smart city frameworks are gaining traction. Accurate three-dimensional data is a cornerstone of these systems, enabling more realistic simulations and better decision-making.
Looking Ahead to Higher Resolution Insights
While the study marks a significant advance, it also highlights areas for further development. The current resolution of 5.5 kilometres, while suitable for global analysis, limits its application at city or neighbourhood scale. Finer resolution data would allow for more detailed urban planning and infrastructure design.
Validation data remains another constraint, particularly in data-scarce regions. Expanding ground-based datasets and integrating new satellite technologies will be key to refining future models. As remote sensing capabilities continue to evolve, there’s every reason to expect improvements in both accuracy and resolution.
What’s clear is that the direction of travel is set. As urbanisation accelerates, particularly across the Global South, understanding the vertical dimension of growth will become increasingly important. Two-dimensional maps won’t cut it anymore.
A Fuller Picture of Urban Evolution
Cities are complex systems, shaped as much by their vertical form as their horizontal footprint. This research brings that reality into sharper focus, offering a more complete view of how urban environments evolve over time.
For the construction and infrastructure sectors, the message is straightforward. Better data leads to better decisions. Whether it’s planning transport networks, designing energy systems, or managing climate risks, understanding how cities grow upwards is no longer optional.
The tools to do that are finally coming into place. The challenge now lies in putting them to work.