







MIT Professor issues a call for ethical thinking about data
In the early decades of the 20th century, city officials in the U.S. began collecting data like they never had before. In St. Louis, starting around 1915, planners fanned out across the city and obtained detailed information about the use and ownership of every property standing.
From this, the city developed its first systematic planning and zoning policies. Some neighbourhoods were designated for new industrial and manufacturing use, with nightclubs, liquor stores, and various less desirable businesses tossed in. On the surface, the goal was economic efficiency, based around distinct business districts.
Below the surface — and not very far down, either — St. Louis’ planning had another effect. Officials had recorded the ethnicity of every property owner. The industrial and less-desirable zoning areas happened to be situated in and around minority neighbourhoods by design. Those residential properties soon declined in value, due to their new settings, and this decrease meant people couldn’t afford to move elsewhere.
St. Louis’ chief planner, Harland Bartholomew, became a national expert on the basis of this kind of work. But such data-driven policies have “reinforced structural racism” in cities, MIT scholar Sarah Williams points out in a new book about data and urban life.
“I believe that often when people think of datasets, they think of them as being the truth, facts, raw information, something not to be questioned,” says Williams, an associate professor of technology and urban planning in MIT’s Department of Urban Studies and Planning. “But I really want everybody to question their data before they go out and use it.”
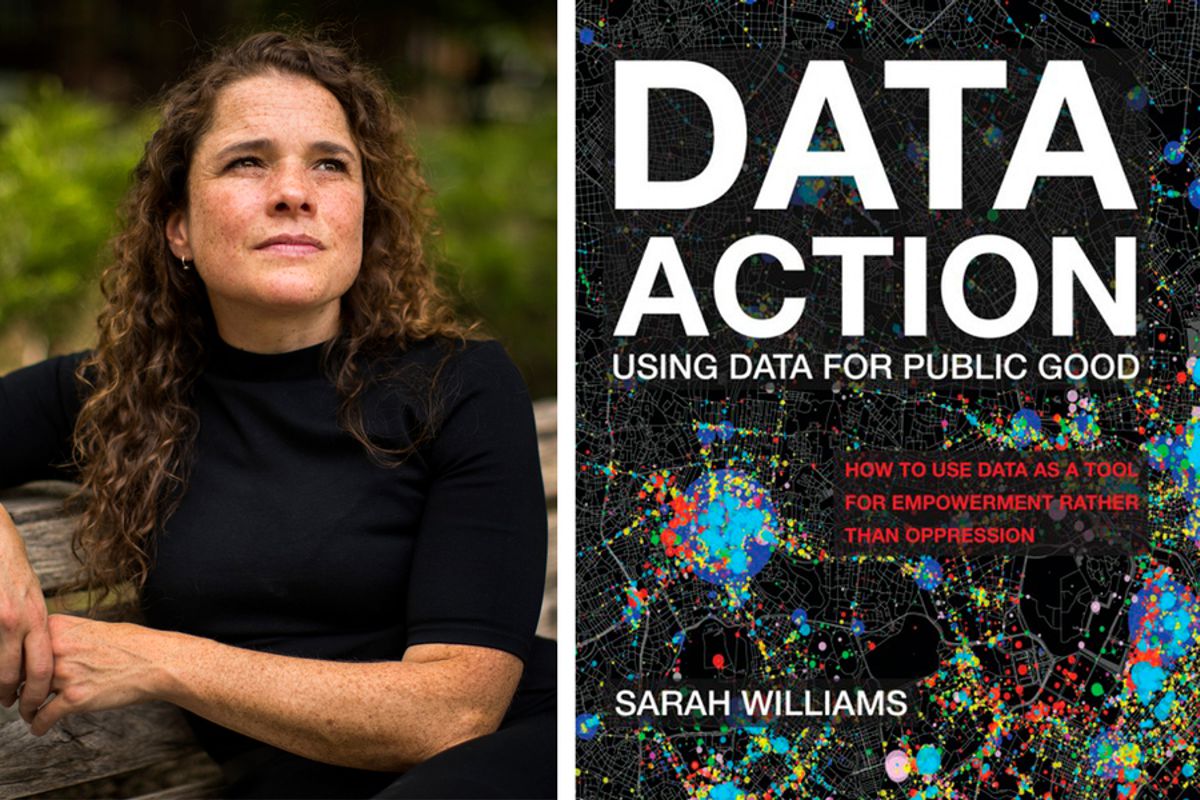
Now in her book “Data Action,” published today by the MIT Press, Williams provides a guide for deploying data in city life, one that draws on historical examples, current developments, and her own research as case studies.
“It’s a call to action to think about the way that data is used in society today,” says Williams.
Build it, hack it, share it
As a guide to action, Williams’ book is structured around three main chapters. One of these, “Build it!”, encourages planners, activists, and scholars to create their own data collection projects. For instance, OpenStreetMap, a widely used alternative to Google Maps, developed out of frustration that basic data were not freely available. This open-source mapping project has been developed from data contributed by people all over the world.
For Williams’ part, she helped create the Beijing Air Tracks project, which used low-cost portable sensors to measure air quality at the 2008 Olympics. Developed along with the Associated Press, the project brought significant attention to China’s pollution and air-quality problems, at a low cost. Indeed, inexpensive mobile technology means people engaged with urban issues can find new ways to study questions.
“It’s hugely different,” says Williams, a faculty affiliate of MIT’s Institute for Data, Systems, and Society. “Fifteen years ago, we didn’t all have smartphones in our pockets that can gather all kinds of data. This means now anyone can collect data, not just the people who have resources. Really the playing field of data collection has been changed by the mobile technologies that are available. … It’s just been transformative.”
In another chapter, titled “Hack it!,” Williams suggests that researchers should be resourceful about collecting large-scale data from private institutions when no comparable public data source exists. This does not mean literally hacking into databases — rather, as Williams writes, “it’s about being creative in the way big data might be used to substitute for missing government data, such as essential population information.” Williams outlines a process that ensures the ethical use of data scraped off websites, and always lets the people running those information sources know about her efforts.
In one study Williams helped run, the “Ghost Cities in China” project, she and her colleagues collected data off Chinese social media sites. The geographic sources of those posts, along with photographs and even drone imagery helped indicate where people were residing — and, in turn, where the Chinese government had overdeveloped some of its massive building projects. This provided a kind of real-time picture of a housing boom and bust, which helped create a new dialogue among planners and policymakers about China’s growth.
But collecting data and conducting rigorous studies are just two elements of using data effectively. In another chapter, “Share it!,” Williams contends that the effective visual presentation of information is an essential part of data-driven research.
When asked, Williams will cite her participation in the “Million Dollar Blocks” project — along with researchers from Columbia University and the Justice Mapping Center — as a good example of data visualization from her own career. That project mapped the places where residents of a Brooklyn block had been incarcerated, while highlighting the costs of incarceration. The project helped provide impetus for the Criminal Justice Reinvestment Act of 2010, which funded job-training programs for former prisoners. And the maps wound up being exhibited at New York’s Museum of Modern Art.
“To open up data for everyone, you have to communicate it visually,” Williams says. “Seeing it on a map opens it up to a much broader public, including policy experts or legislators or a company or a business analyst. Remember that communication is as big a part of data analytics as the statistics and insights themselves.”
Data is not neutral
To be sure, Williams acknowledges, she herself enters into data-mapping projects with her own ethical views and advocacy goals. What matters, in her view, is being transparent about this.
“I think it’s always important to ask yourself: What is your objective? One thing I say to my students about the Million-Dollar Blocks map is, ‘Yeah, My map is biased. Is that okay?’ I think it’s okay, because the story I’m telling, and the position I’m taking is one that I hope will benefit society and be used for a public good. Everybody’s using their data to act in some kind of way. … No matter how much you try, data is not neutral.”
Williams, for her part, hopes to reach a broad audience, from scholars and planners to activists and anyone who like cities, data, or both. And she emphasizes that using data to make cities better is not a passive activity for observers — it’s a process that helps communities and advocacy groups form and then sustain themselves.
“Empowering people to do data collection is part of what I hope this book does,” Williams says. “If something’s going on in your community, collect that data. It also creates an organizing framework and a community. People who were previously working independently now come together on a particular project. Moving toward this common goal often helps them build the energy and the capacity to work for the changes they need.”